
Sparklines.
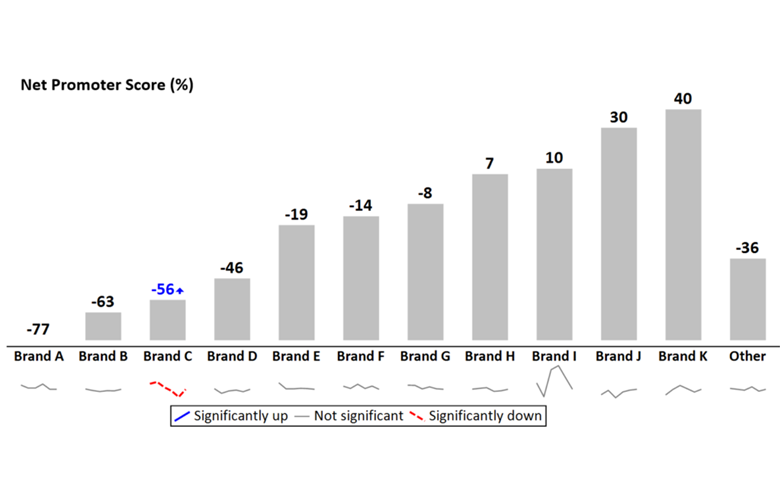
Using Sparklines to Show Trends in Bar and Column Charts
Using sparklines in charts with multiple series of data improves readability by showing where are we today, movement since last time and long-term trend.
Continue reading