
Streamgraph.
How to Create a Streamgraph in Displayr
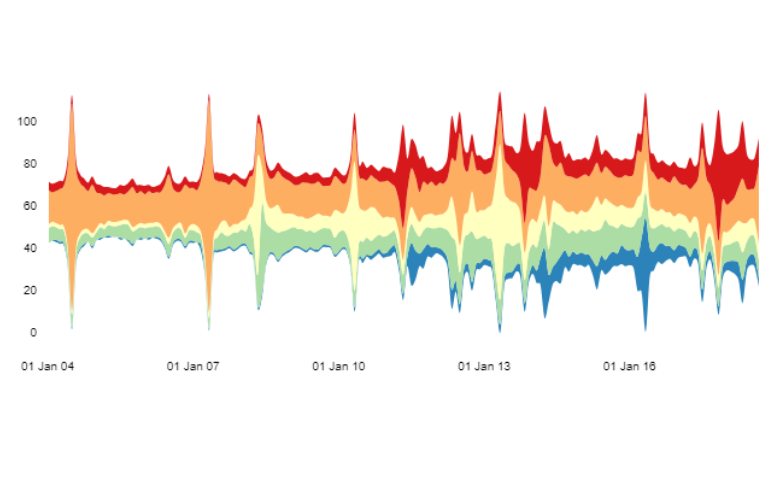
The streamgraph is a type of stacked area chart. It is modified so that the streams are centered around the y-axis and often has a flowing organic shape.
Continue reading