
Time Series.
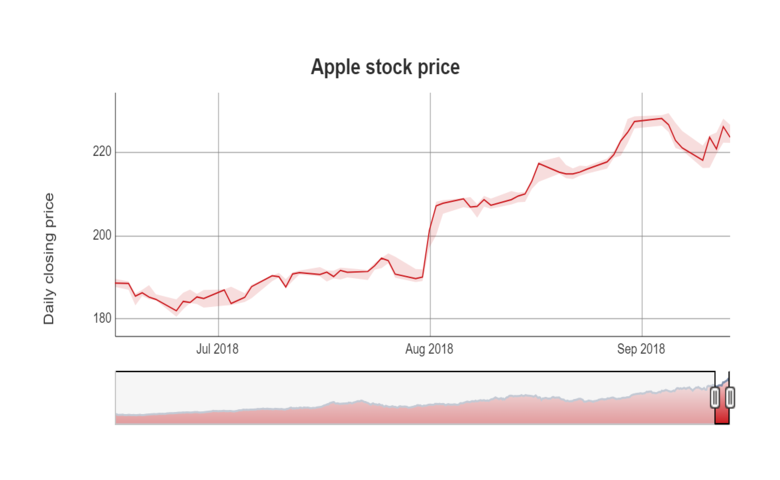
How to Create a Time Series Graph in Displayr
A time series graph has the ability to zoom in or out. It allows viewers to explore the time series at a range of time scales.
Continue reading
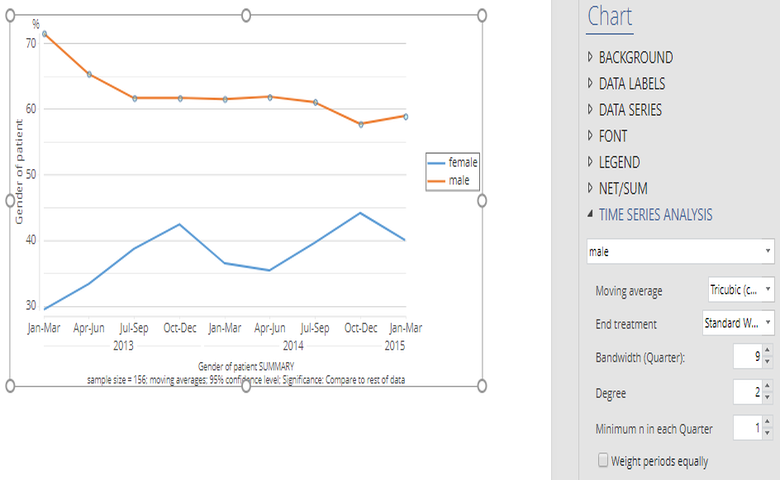
2 Ways to Smooth Time Series in Displayr
Displayr has two methods for smoothing time series data. One is easier for summarised data, and the second for raw data (i.e. survey responses over time). We'll...
Continue reading