
Using Q.

Using Q to Customize Tables in Displayr
Strategy 1: Moving QPacks between the products In your Displayr document: Export > Embed > Update all. This causes all your most recent changes to…
Continue reading
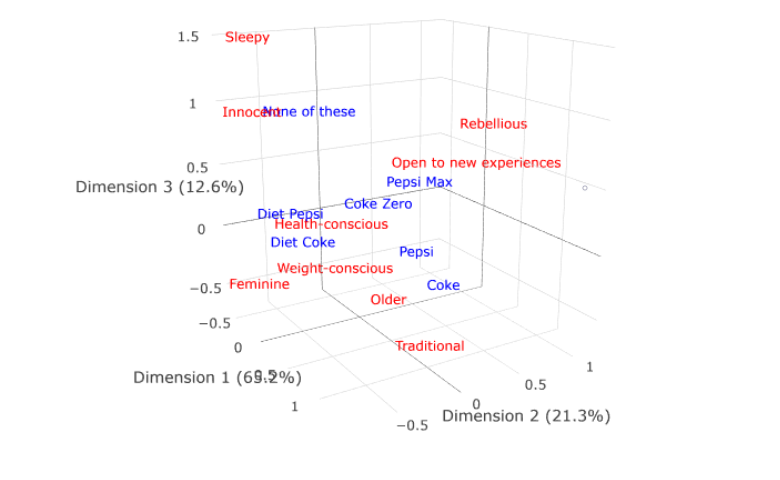
3D Correspondence Analysis Plots in Q
The default correspondence analysis charts in Q are two-dimensional scatterplots. You can create a three-dimensional plot by writing a small amount of code.
Continue reading