Q Research Software (Q) is the most complete tool for quickly creating crosstabs and for any type of market research analysis. It automates hours of grunt work and makes it easy for researchers to quickly discover the story in their data.
Questions people frequently ask when buying crosstab software
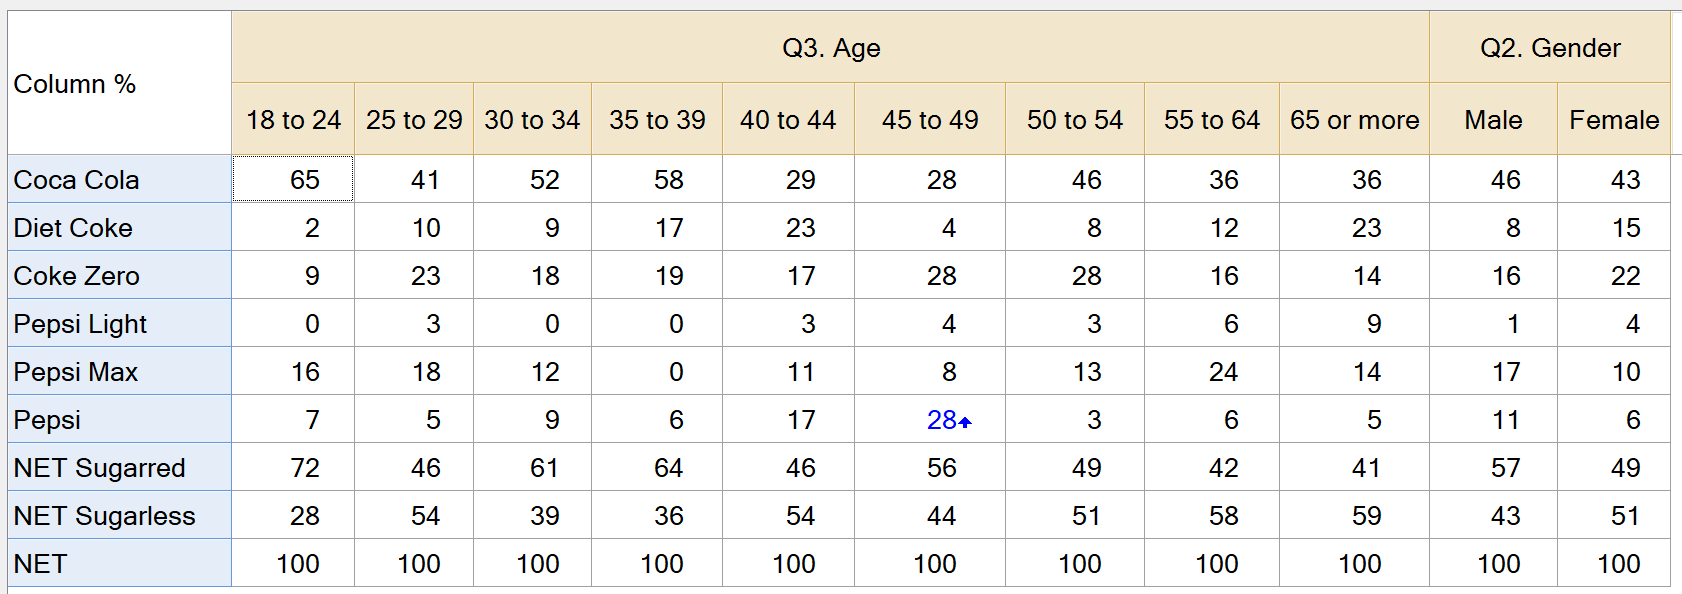
How do I know if differences are statistically significant?
Most crosstab software, like Q Research Software, Survey Reporter, and MarketSight automatically calculate statistical significance. Some tools like Q Research Software also allow for the option of different types of significance testing to be shown (e.g., the more traditional lettering to compare columns or tests showing the significance of each cell).
How do I churn out large numbers of crosstabs quicky?
Programs like Q Research Software will automatically create crosstabs for all types of data within a single interface. Other programs like SPSS will require the data to be standardized to categorical and then have syntax written to perform such a procedure.
How do I find the most interesting tables?
When a large number of crosstabs are created, a practical challenge is how to quickly evaluate them. Q Research Software is the only product with tools to either automatically find and delete those with no statistically significant results or to sort and group tables according to levels of statistical significance.
Can I easily create a banner?
Simple banners are pretty much all packages designed specifically for market research data. Wincross, Quantum, and Q Research Software also have the ability to create complicated banners using simple logic and these can be added to existing banners.
How do I chart or visualize crosstabs?
Most tools will have inbuilt basic charting. Q Research Software is the only tool that allows for editable charts to be exported to Microsoft Office and has advanced visualizations for crosstabs such as pictographs, heatmap and ranking plots.