Displayr turns your survey data into analysis, reports, and answers — with every number traced back to the tables, tests, weights, variables, and source so you can verify it.
AI can summarize almost anything. It can also sound confident when it is wrong. That is a problem when your work needs to survive a client meeting or methodology review.
Displayr is built for answers that hold up under questioning,
defensible by design, not by hope.
Clean the data, create the analysis, build the report, and let stakeholders ask questions — all in one connected AI-powered workflow.
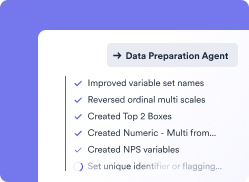
Clean, label, tidy, code open ends, create top boxes, and fix the hidden mess that slows research down.
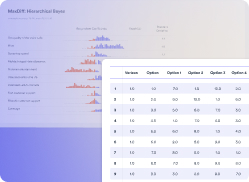
Create crosstabs, banners, driver analysis, segmentation, MaxDiff, correspondence analysis, conjoint, weighting, and more.
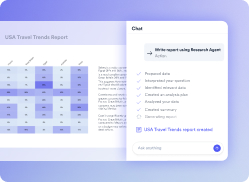
Turn analysis into pages, charts, commentary, summaries, recommendations, and PowerPoint-ready outputs.
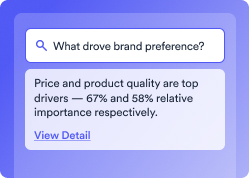
Publish reports stakeholders can interrogate, with answers linked back to the evidence behind them.
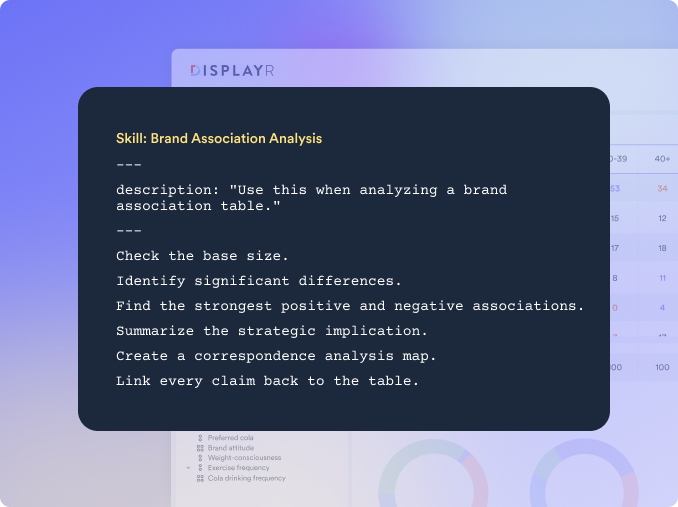
Every research team has a way it likes things done: the checklist, the analysis standard, the chart style, the naming rules, the brand health method. With Displayr Skills, you can turn those methods into repeatable AI workflows that run the work your way.
Displayr is designed for teams working with client, customer, and commercial data — where security, governance, and accountability matter as much as speed.
SOC 2 Type II, enterprise controls, and regional hosting options for teams with strict data requirements.
Researchers can review, edit, rerun, and approve AI-assisted work before it reaches clients or stakeholders.
Keep analysis, reporting, evidence, and stakeholder access inside one connected workflow instead of scattered across files, prompts, and code.

Deliver more work, faster, without handing clients a black-box AI summary you cannot defend.
Answer business questions faster and give stakeholders live reports they can interrogate themselves.
Use AI to trigger specialist analysis, automate repeat workflows, and preserve your methodology.

Founder, MAC Research
