





The simpler way to create experimental designs, analyze conjoint data, and create simulators – all in one complete analysis and reporting app.
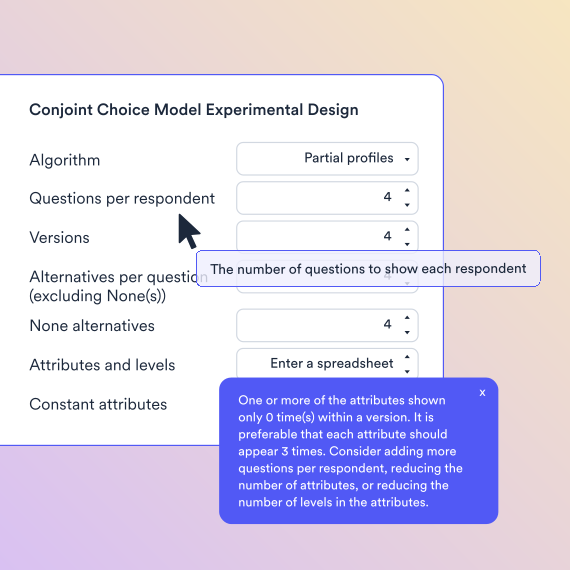
No matter which type of experimental design you require, we’ve got you covered, including efficient designs, partial profile designs, randomized designs, shortcut designs, prohibitions, orthogonal designs, and more. Displayr even guides you with suggestions and warnings to help you avoid making silly mistakes.
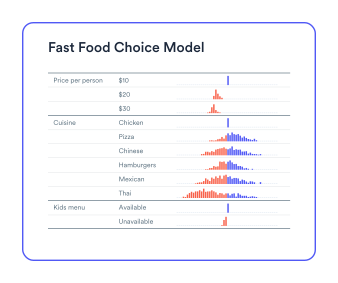
Estimate any one of the key choice models, including HB (recommended), latent class analysis, multinomial logit, and multi-class HB. Color-coded summaries and histograms make it easy to interpret results.
AI does the setup work: generating an efficient experimental design from your attributes, running the hierarchical Bayes estimation, and building the simulator once results are in. Every utility and share prediction traces back to the design and the model behind it, so when a client asks why a feature scored the way it did, you can show them.
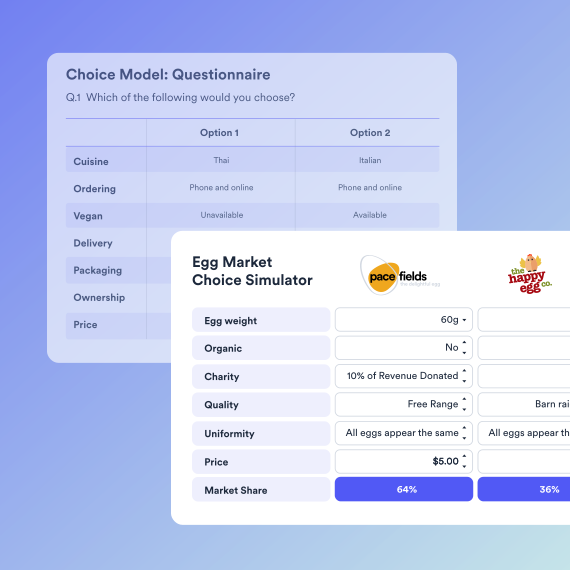
Create an interactive simulator in a couple of mouse clicks – it’s that easy. Goodbye, excel macros! Displayr has all the formatting tools to make your simulator look branded and beautiful. Secure access with logins and passwords. Allow clients to run their own simulations and explore the data – hassle-free!
Displayr is not just a Conjoint platform; it excels in every aspect including visualization, trend analysis, crosstabs, advanced analytics, dashboards, PowerPoint reporting, data apps, and more. Once you have your Conjoint analysis, you can seamlessly integrate it into your reports and even update everything automatically with new insights.

Founder, MAC Research

SQL, databases, Excel, CSV, text, SPSS, survey platforms, APIs, integrations, & more.

Summary tables, crosstabs, pivot tables, regression, text analysis, segmentation, machine learning, & more.

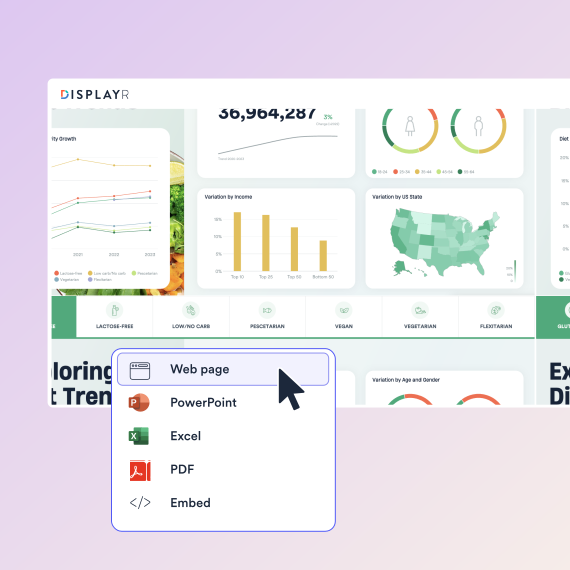
Data visualization, interactive data apps, dashboards, presentations, PowerPoint, Excel, PDF, web pages, & more.

Displayr’s Research Agents integrate AI across your full workflow, from data cleaning to analysis to reporting.
Displayr helps Data Expert deliver custom solutions faster
More on conjoint in Displayr:
Some typical examples of conjoint include:
Conjoint analysis is a quantitative research method.
Choice-based conjoint shows respondents sets of complete product profiles and asks which they’d choose, rather than asking them to rate features individually. It’s the most common form of conjoint because it mirrors how people actually buy – trading off price against features – and it produces utilities you can turn into a market simulator.
Meet with us to find the gaps and see where AI can give you an edge.