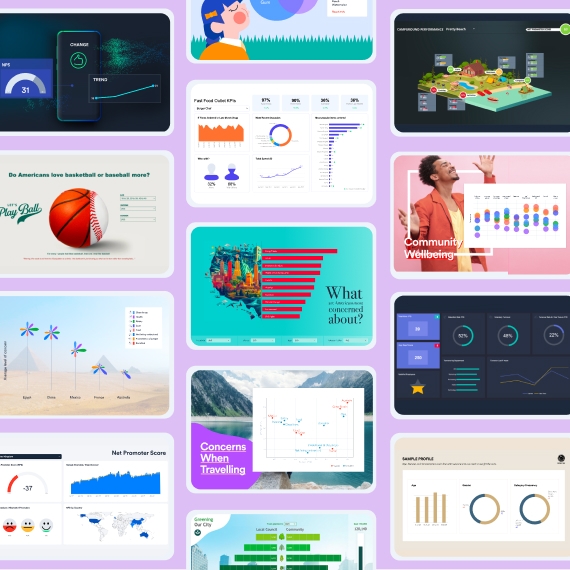
Displayr is analysis and reporting software built to help you find deeper insights in your Qualtrics data.

Qualtrics survey software powers over a billion surveys every year. It’s easy to use and can handle everything from simple questionnaires to detailed research projects.
If you are under pressure to deliver powerful insights but faster the Qualtrics + Displayr partnership will help. Benefit from deeper analysis, advanced crosstabbing capabilities, rapid PowerPoint reporting, and live dashboards. Clarity from insights at your fingertips.


Connect Qualtrics to Displayr and automatically update your analysis and report as new results appear. Plus, Displayr instantly cleans & formats your Qualtrics data, so you are ready to go fast.
With Displayr, everything that can be automated is automated, including cleaning & formatting data, statistical testing, generating tables and crosstabs – and formatting and structuring them, updating analyses, weights, PowerPoint reporting, and reproducing dashboards.


Easily go deeper into your analysis (no need for a textbook to determine which button to click). All analysis techniques at your fingertips including regression, PCA, clustering, latent class analysis, machine learning, MaxDiff, conjoint, TURF, and so much more. In fact, there’s no advanced analysis you cannot perform in Displayr.
With Displayr, any report exports to PowerPoint. Automatically refresh entire PowerPoint reports when new responses appear in Qualtrics. Displayr’s got all your reporting needs covered, from webpages and dashboards, to exporting to PowerPoint, Excel, or as a PDF, to embedding interactive visualizations in your blog.


A powerful, collaborative analysis and reporting tool built for humans, not robots. SQL, R, and no-code work together so you can analyze, visualize, and build your report all at the same time in the same app. Instantly visualize what you are learning.
Discover how smooth collaborating with your team can be. No more versioning files or waiting on others; now, you can all work on the same document in real-time. Watch it all come together – like magic.

More information about the Qualtrics integration can be found: ‘How to import Data from Qualtrics‘ and on our general Integrations page.
If you have a data platform that can connect to Displayr via an API, reach out here and provide the relevant information.
The main benefit is one of speed. You’ll be analyzing your data quickly. You will also have a lot less error because everything, from the raw data to the analysis to the report is fully connected and tracable.
While you can create very similar dashboards in Displayr, the real benefit of creating dashboards in Displayr is its flexibility. Creating a dashboard in Displayr is like creating a data story in PowerPoint, where you can insert images, put analyses and visualizations anywhere on the page, insert text, and only be limited by your imagination.
Qualtrics: This platform is primarily designed as a survey tool, enabling users to create, distribute, and analyze surveys. It does offer some statistical analysis features, but its main focus is on the survey aspect.
Displayr: In contrast, Displayr is built specifically for in-depth statistical analysis and the reporting of survey data. It provides a more robust set of tools for data analysis, which makes it particularly well-suited for handling complex survey data and generating detailed reports.
If your primary need is conducting surveys with some level of analysis, Qualtrics would be a suitable choice. However, if you frequently deal with complex survey data and require extensive statistical analysis and reporting capabilities, the combination of Qualtrics and Displayr would be more advantageous. The partnership between the two can offer a comprehensive solution for both survey creation and advanced data analysis.

Research Analyst, dunnhumby
© 2025 Displayr Pty Ltd. All rights reserved.

