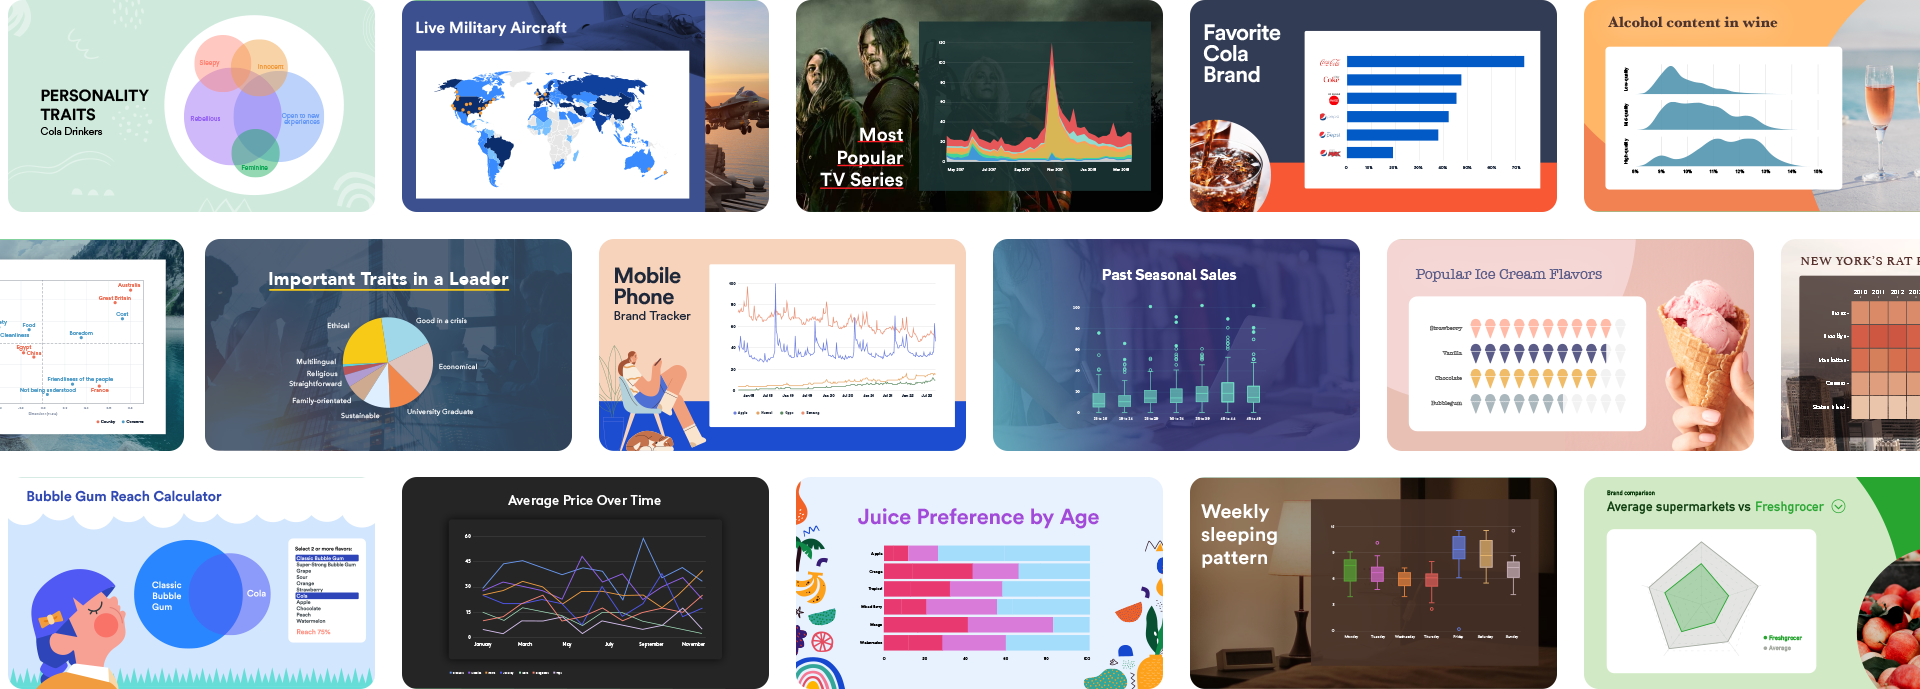
Transform your data into beautiful interactive graphs and charts in seconds.
Area charts are best used when you need to compare a small number of categories and know how big the change is.
Bar charts are ideal for comparing two or more values, or values over time and are a great way to draw attention to spikes or changes.
One of the most classic ways of visualizing data. The area of each slice of the pie chart is the quantity it represents in proportion to the total.
Venn diagrams are a fun and easy to understand way to visualize the overlap between variables in your data but also where they differ.
Box plots, also called box and whisker plots or box and whisker graphs, are used to show the median, interquartile range and outliers for numeric data.
Line charts are usually used to plot changes over a continuous interval or time. They are best for showing the rate or flow of change over time.
The length of each leaf shows the individual components of the overall score, while the height of tree represents the overall score.
A radar chart can be an intriguing way of presenting your data. Radar charts are effectively a line or area chart, wrapped around a central axis.
A scatterplot is a type of two-dimensional data visualization that uses dots to represent the values of two different variables.
Choropleth map data visualizations are a fantastic way to show comparative values across countries, states, or regions.
A heat map shows individual values in a matrix. The values are color coded on a graded color scale and shaded in proportion to the numbers in the cell.
Sankey diagrams are an awesome way of visualizing the flow of data, where the width of each flow is based on its quantity.
Stream graphs show changes in data for different categories over time with the use of flowing shapes that resemble a river or a stream.
Density plots are best used when you are trying to understand the shape of the distribution of some data over a continuous interval or time period.
A histogram is used to visualize the underlying frequency distribution or shape of a set of continuous numeric data.
Pictographs are an awesome data visualization that can be both visually engaging and informative.

Easily create beautiful, interactive dashboards and online reports. Make bar graphs, pie charts, venn diagrams, line graphs, histograms and everything in between with Displayr’s graph maker. Import data in seconds and easily switch between different types of graphs to find the best presentation of your data.


Senior Research Analyst, dunnhumby