Skip to content
877-401-1897
Login
Free Trial
Product
TECHNIQUES
Research Agent
Market Research
Tables & Crosstabs
Text Analytics
Statistical Testing
Weighting
Factor Analysis
Driver Analysis
TECHNIQUES
Generative AI
Correspondence Analysis
Cluster & Latent Class
MaxDiff
Conjoint
TURF
Regression
OBJECTIVES
New Product Development
Longitudinal Analysis
Customer Feedback
Segmentation
Brand Analytics
Advertising Research
Pricing Research
CAPABILITIES
Survey Analysis
Data Cleaning
Data Visualization
Story Finding
PowerPoint Automation
Automatic Updating
Dashboarding
Data App Building
DATA SOURCES
Integrations
Pricing
Resources
LEARN
Blog
Ebooks & Webinars
Compare Tools
Success Stories
Reviews
Gallery
Demo Videos
The Market Research Guide
The Data Story Academy
AI Readiness Quiz
SUPPORT
Help Center
What’s New
UPCOMING WEBINAR
Register now
Submit
Book a demo
877-401-1897
Book a demo
Start free trial
Book a demo
Sort
Search Examples
Categories
All
AI-Generated
Infographic
Interactive
Multi-Page
PowerPoint Automation
Tracking
Explore market research reports and interactive dashboards
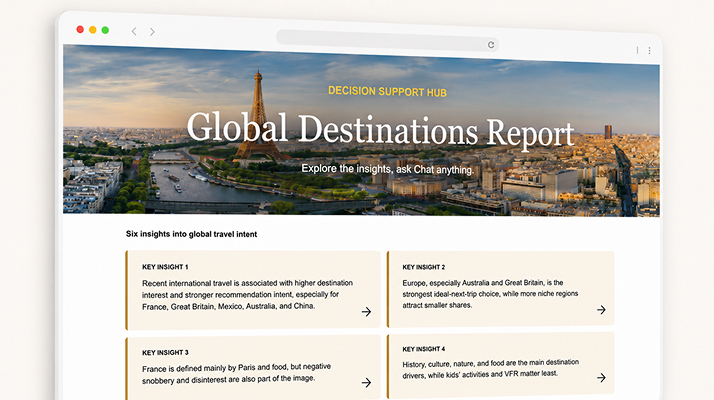
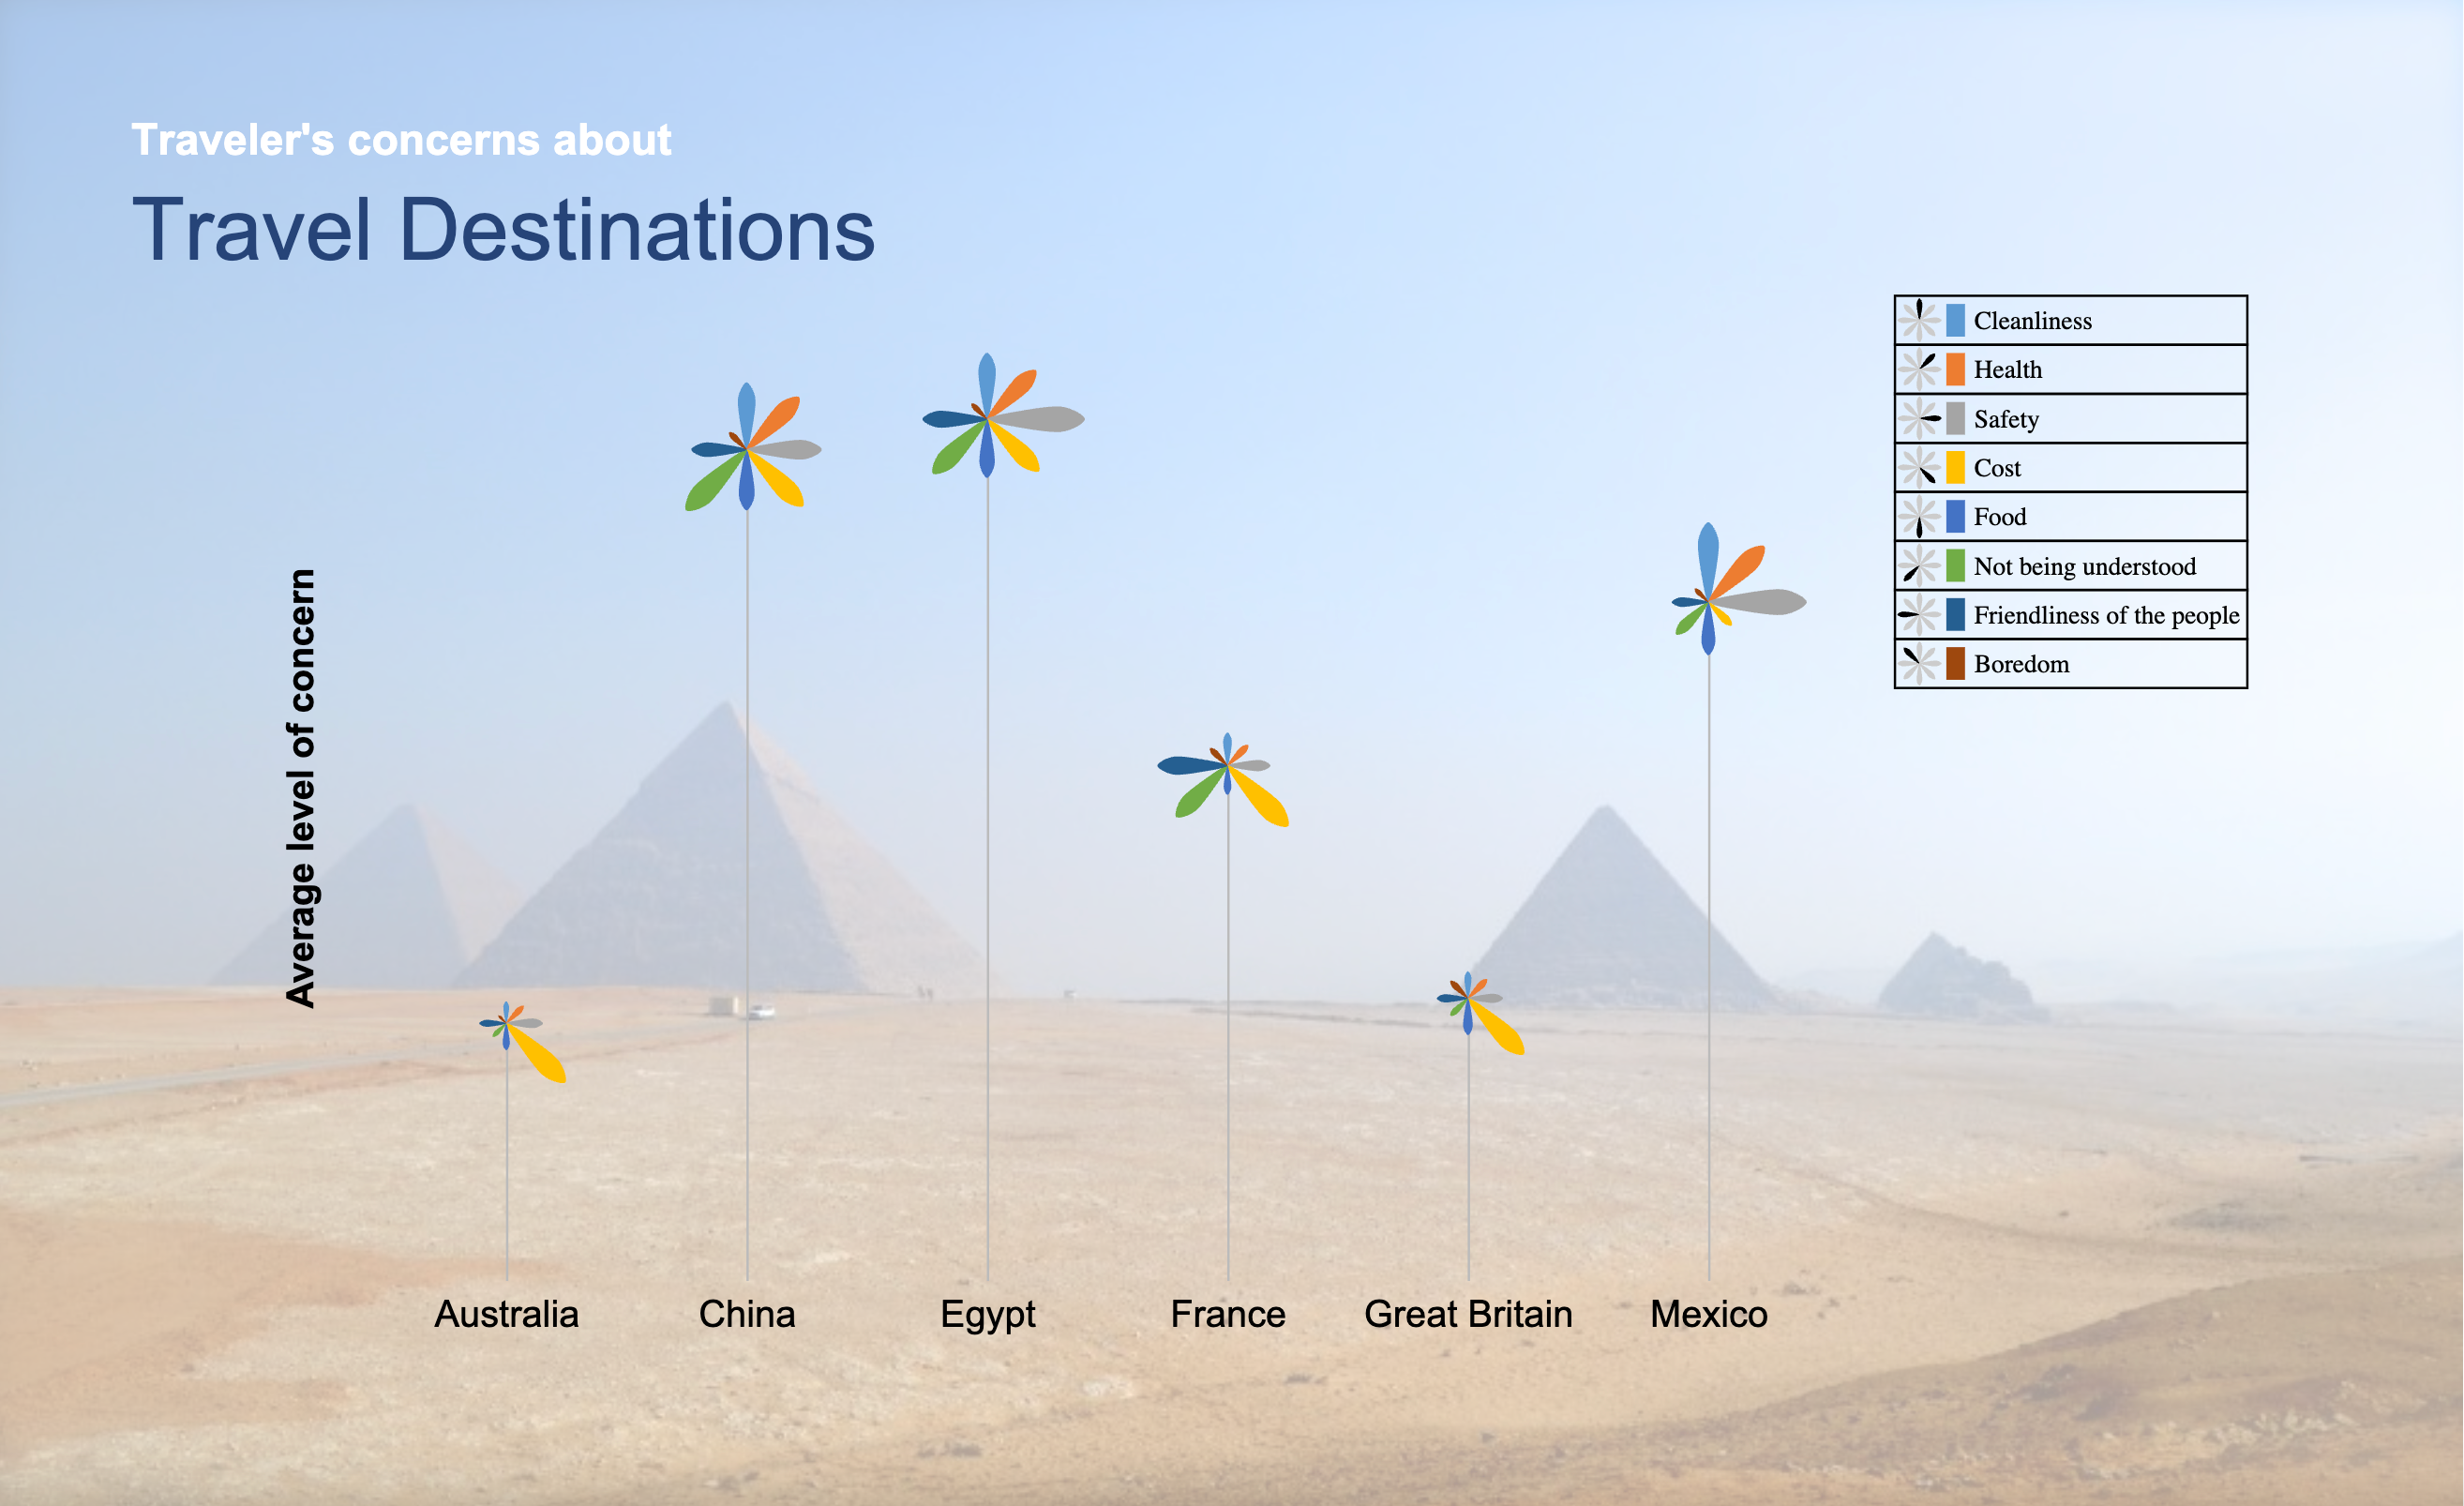
Global Destinations Report
AI-Generated
,
Interactive
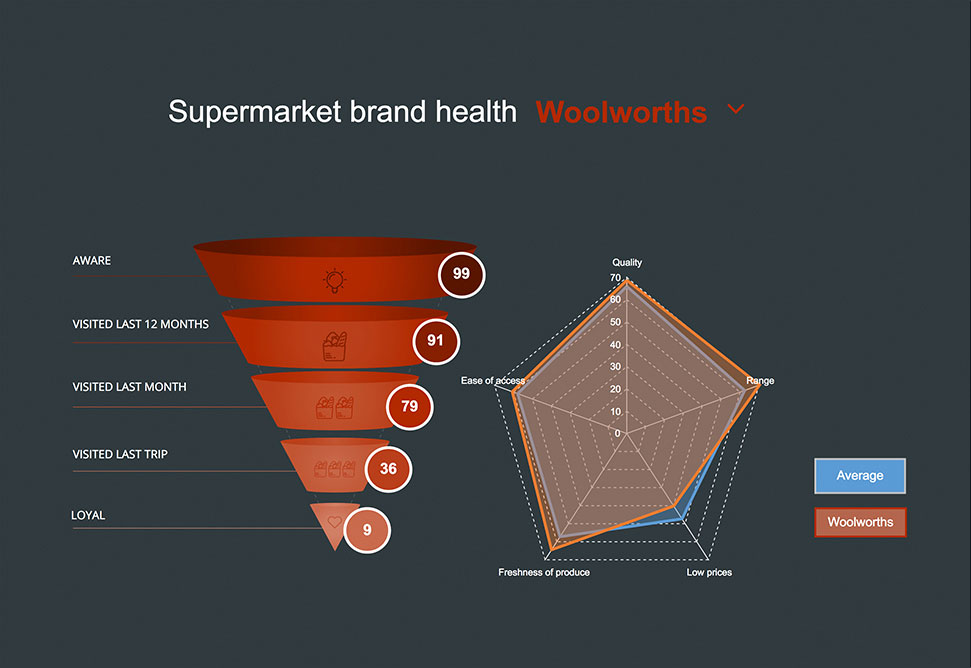
A Brand Health Dashboard (Live Template)
Interactive
,
Tracking
AI-Powered Sentiment Analyzer
Interactive
,
Multi-Page
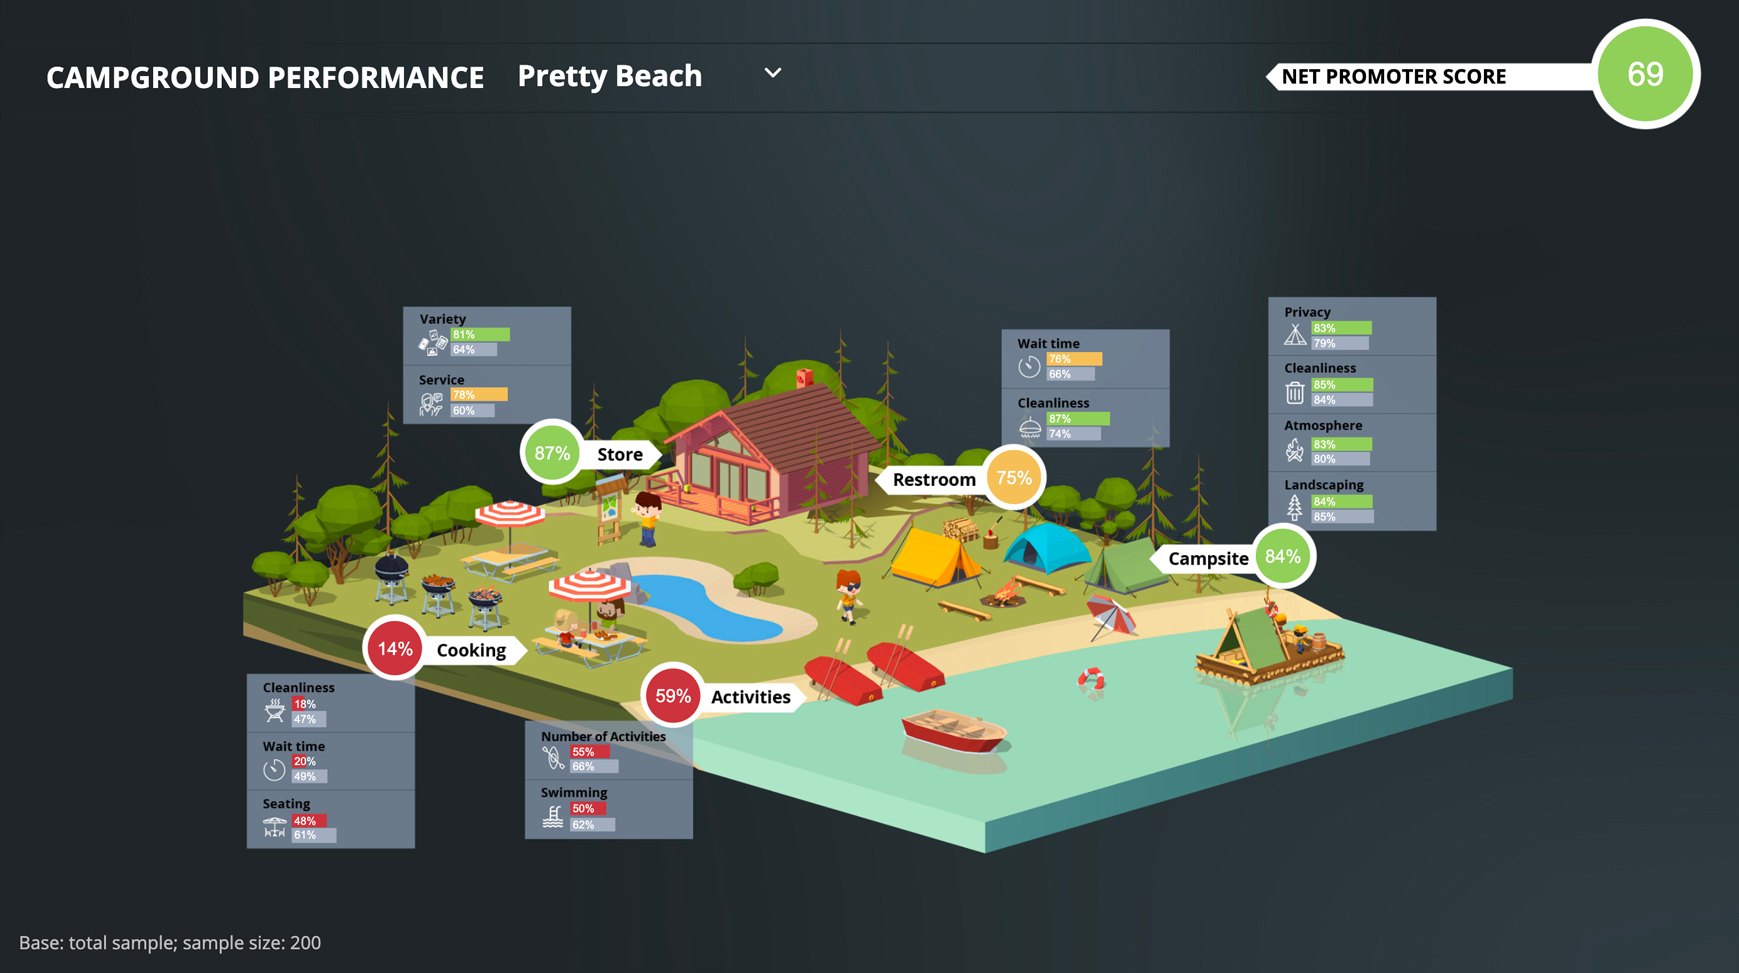
Campground Performance Dashboard
Infographic
,
Interactive
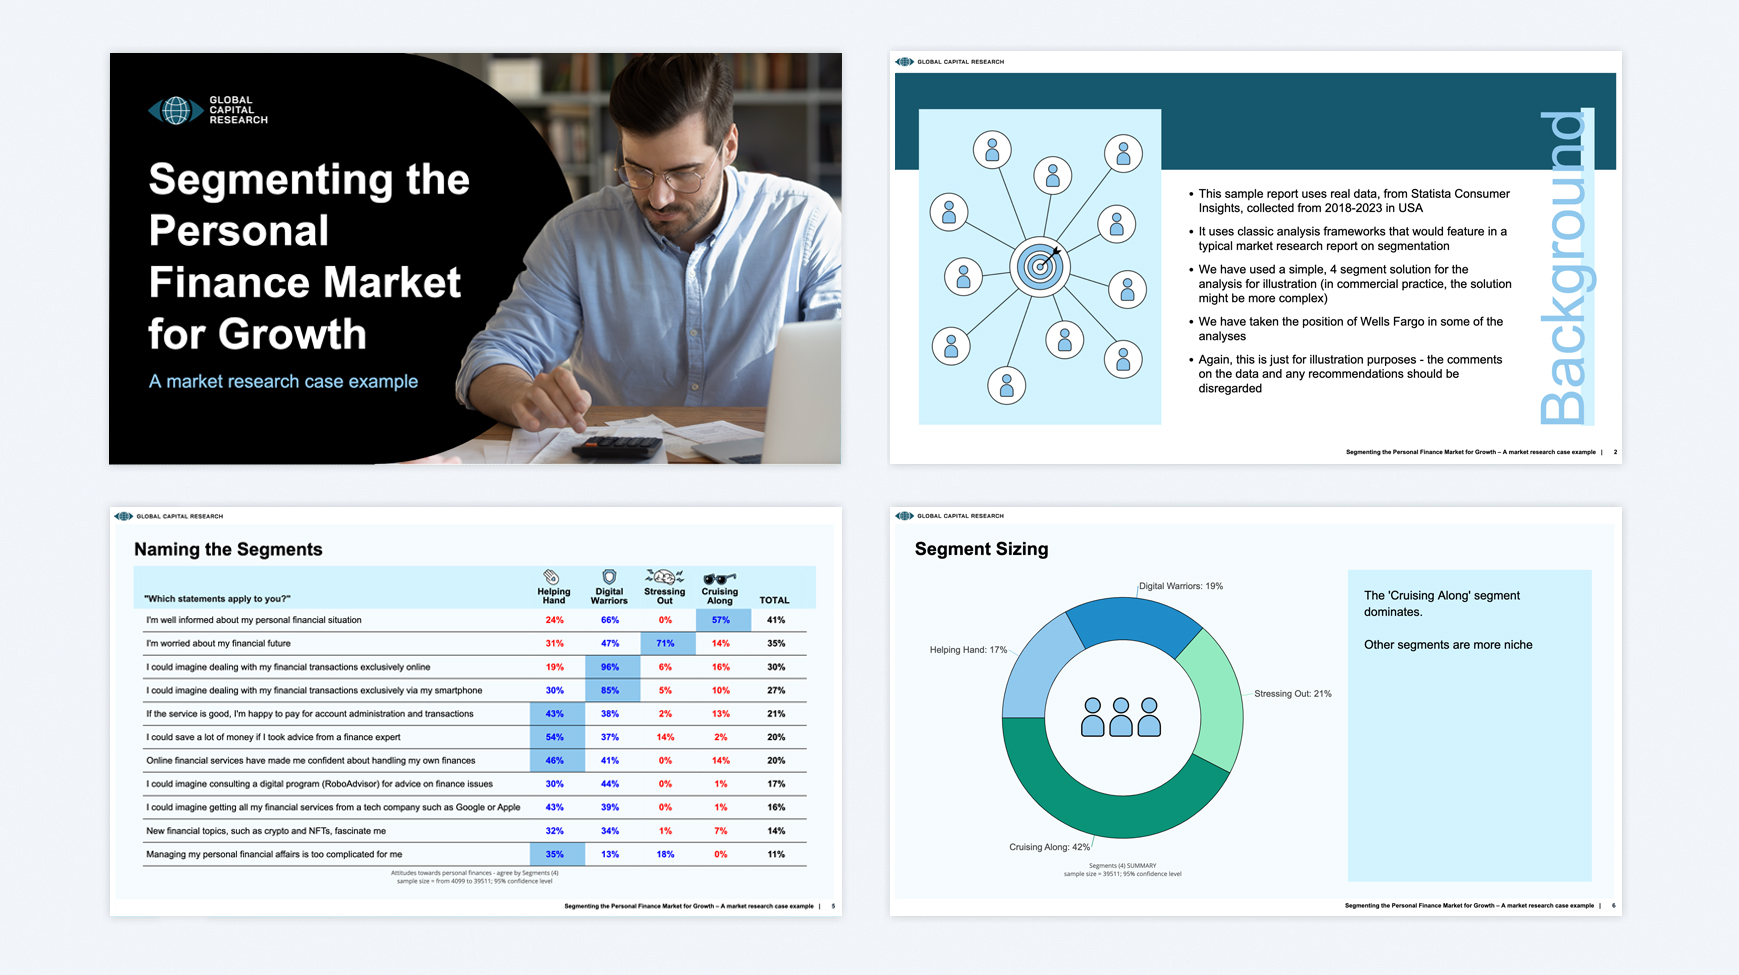
Financial Segmentation Dashboard
Interactive
,
Multi-Page
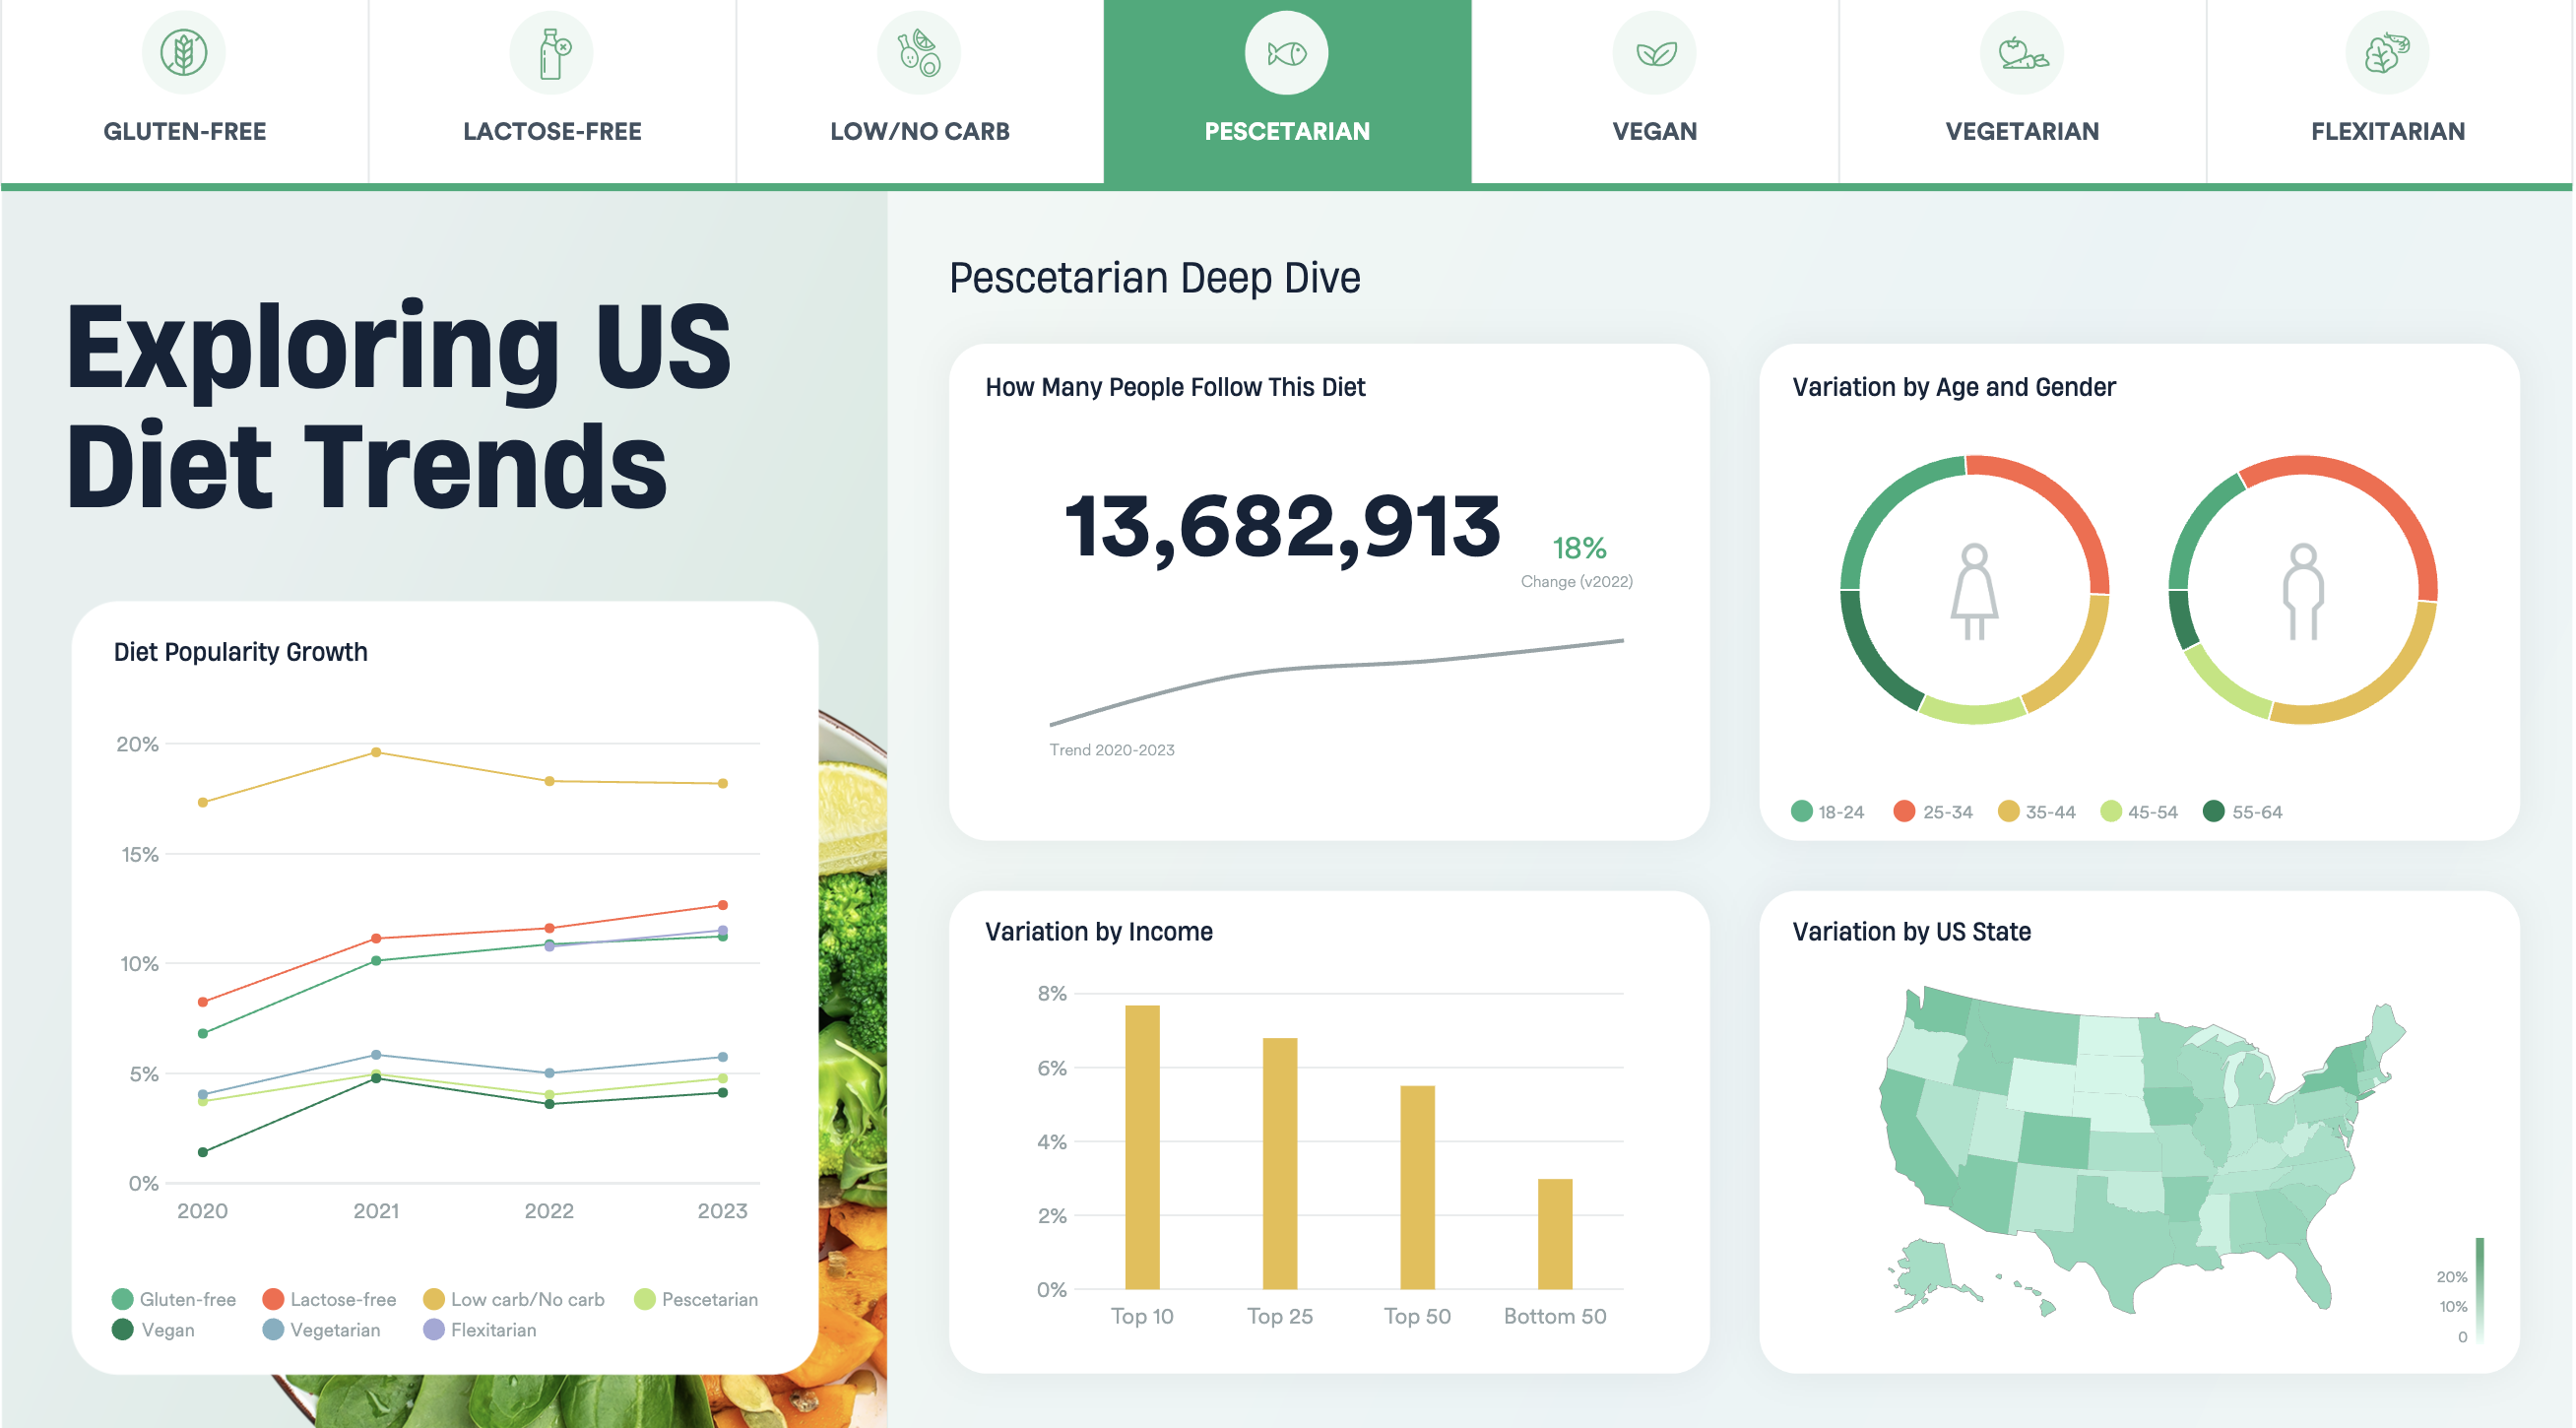
Exploring US Diet Trends
Interactive
,
Multi-Page
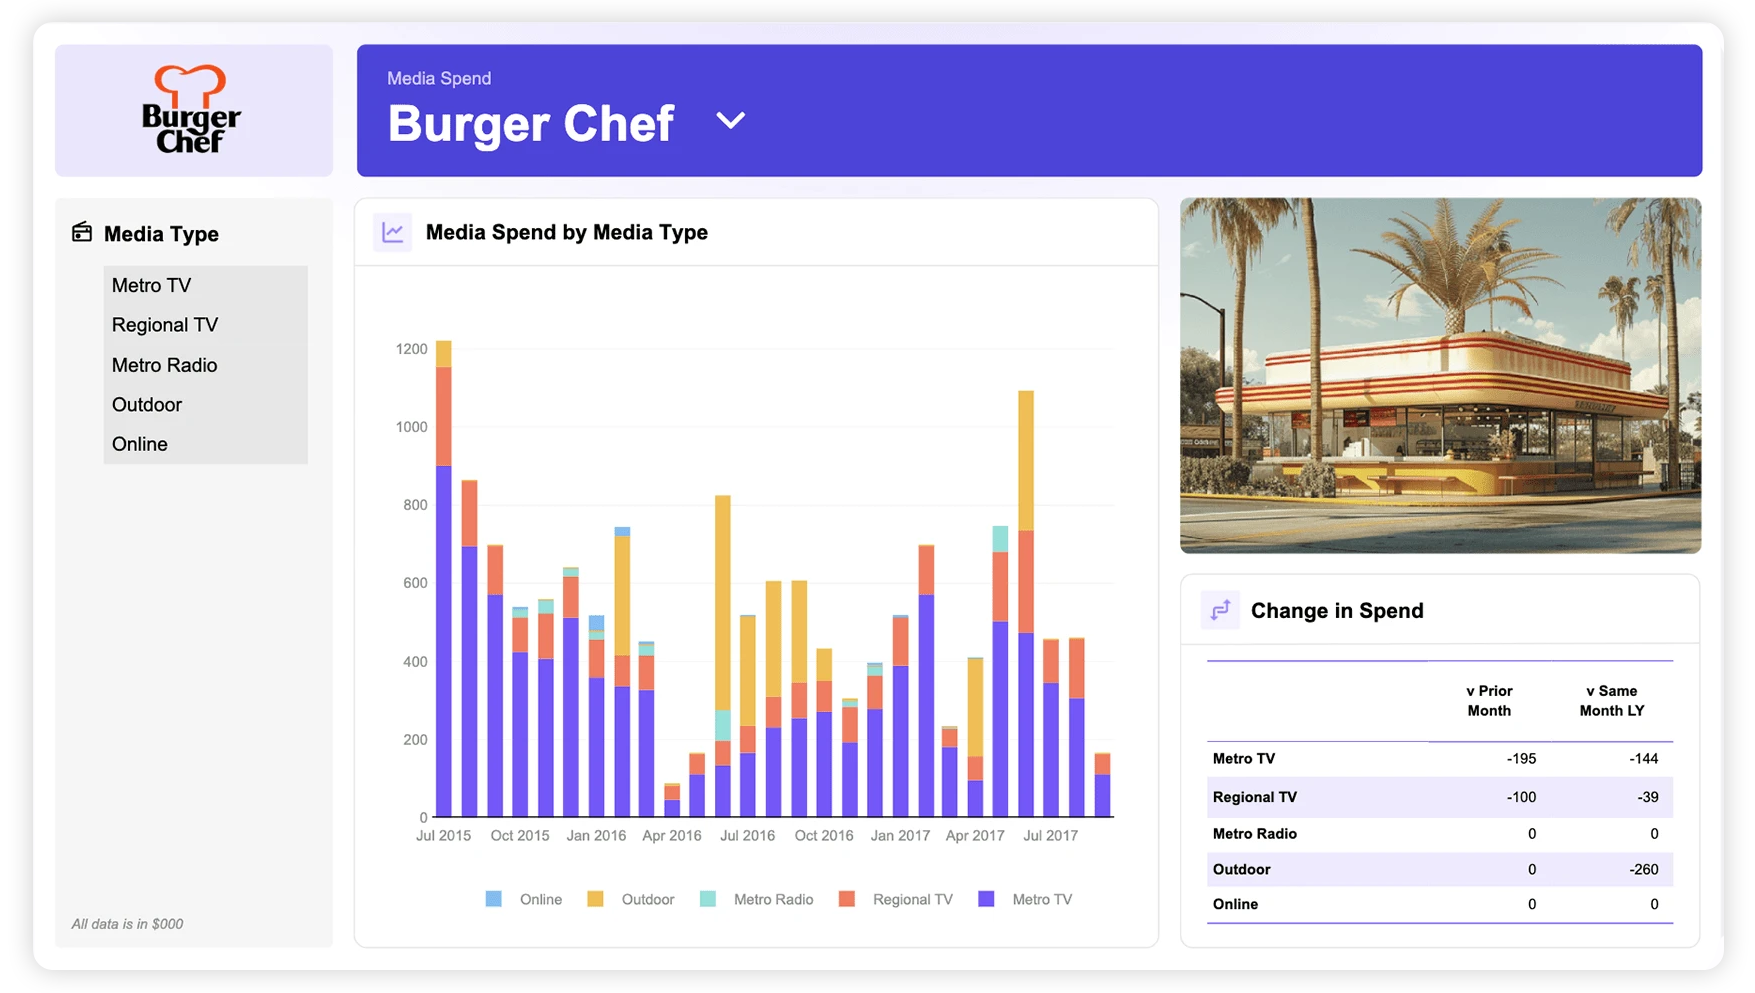
Media Spend Dashboard
Infographic
,
Interactive
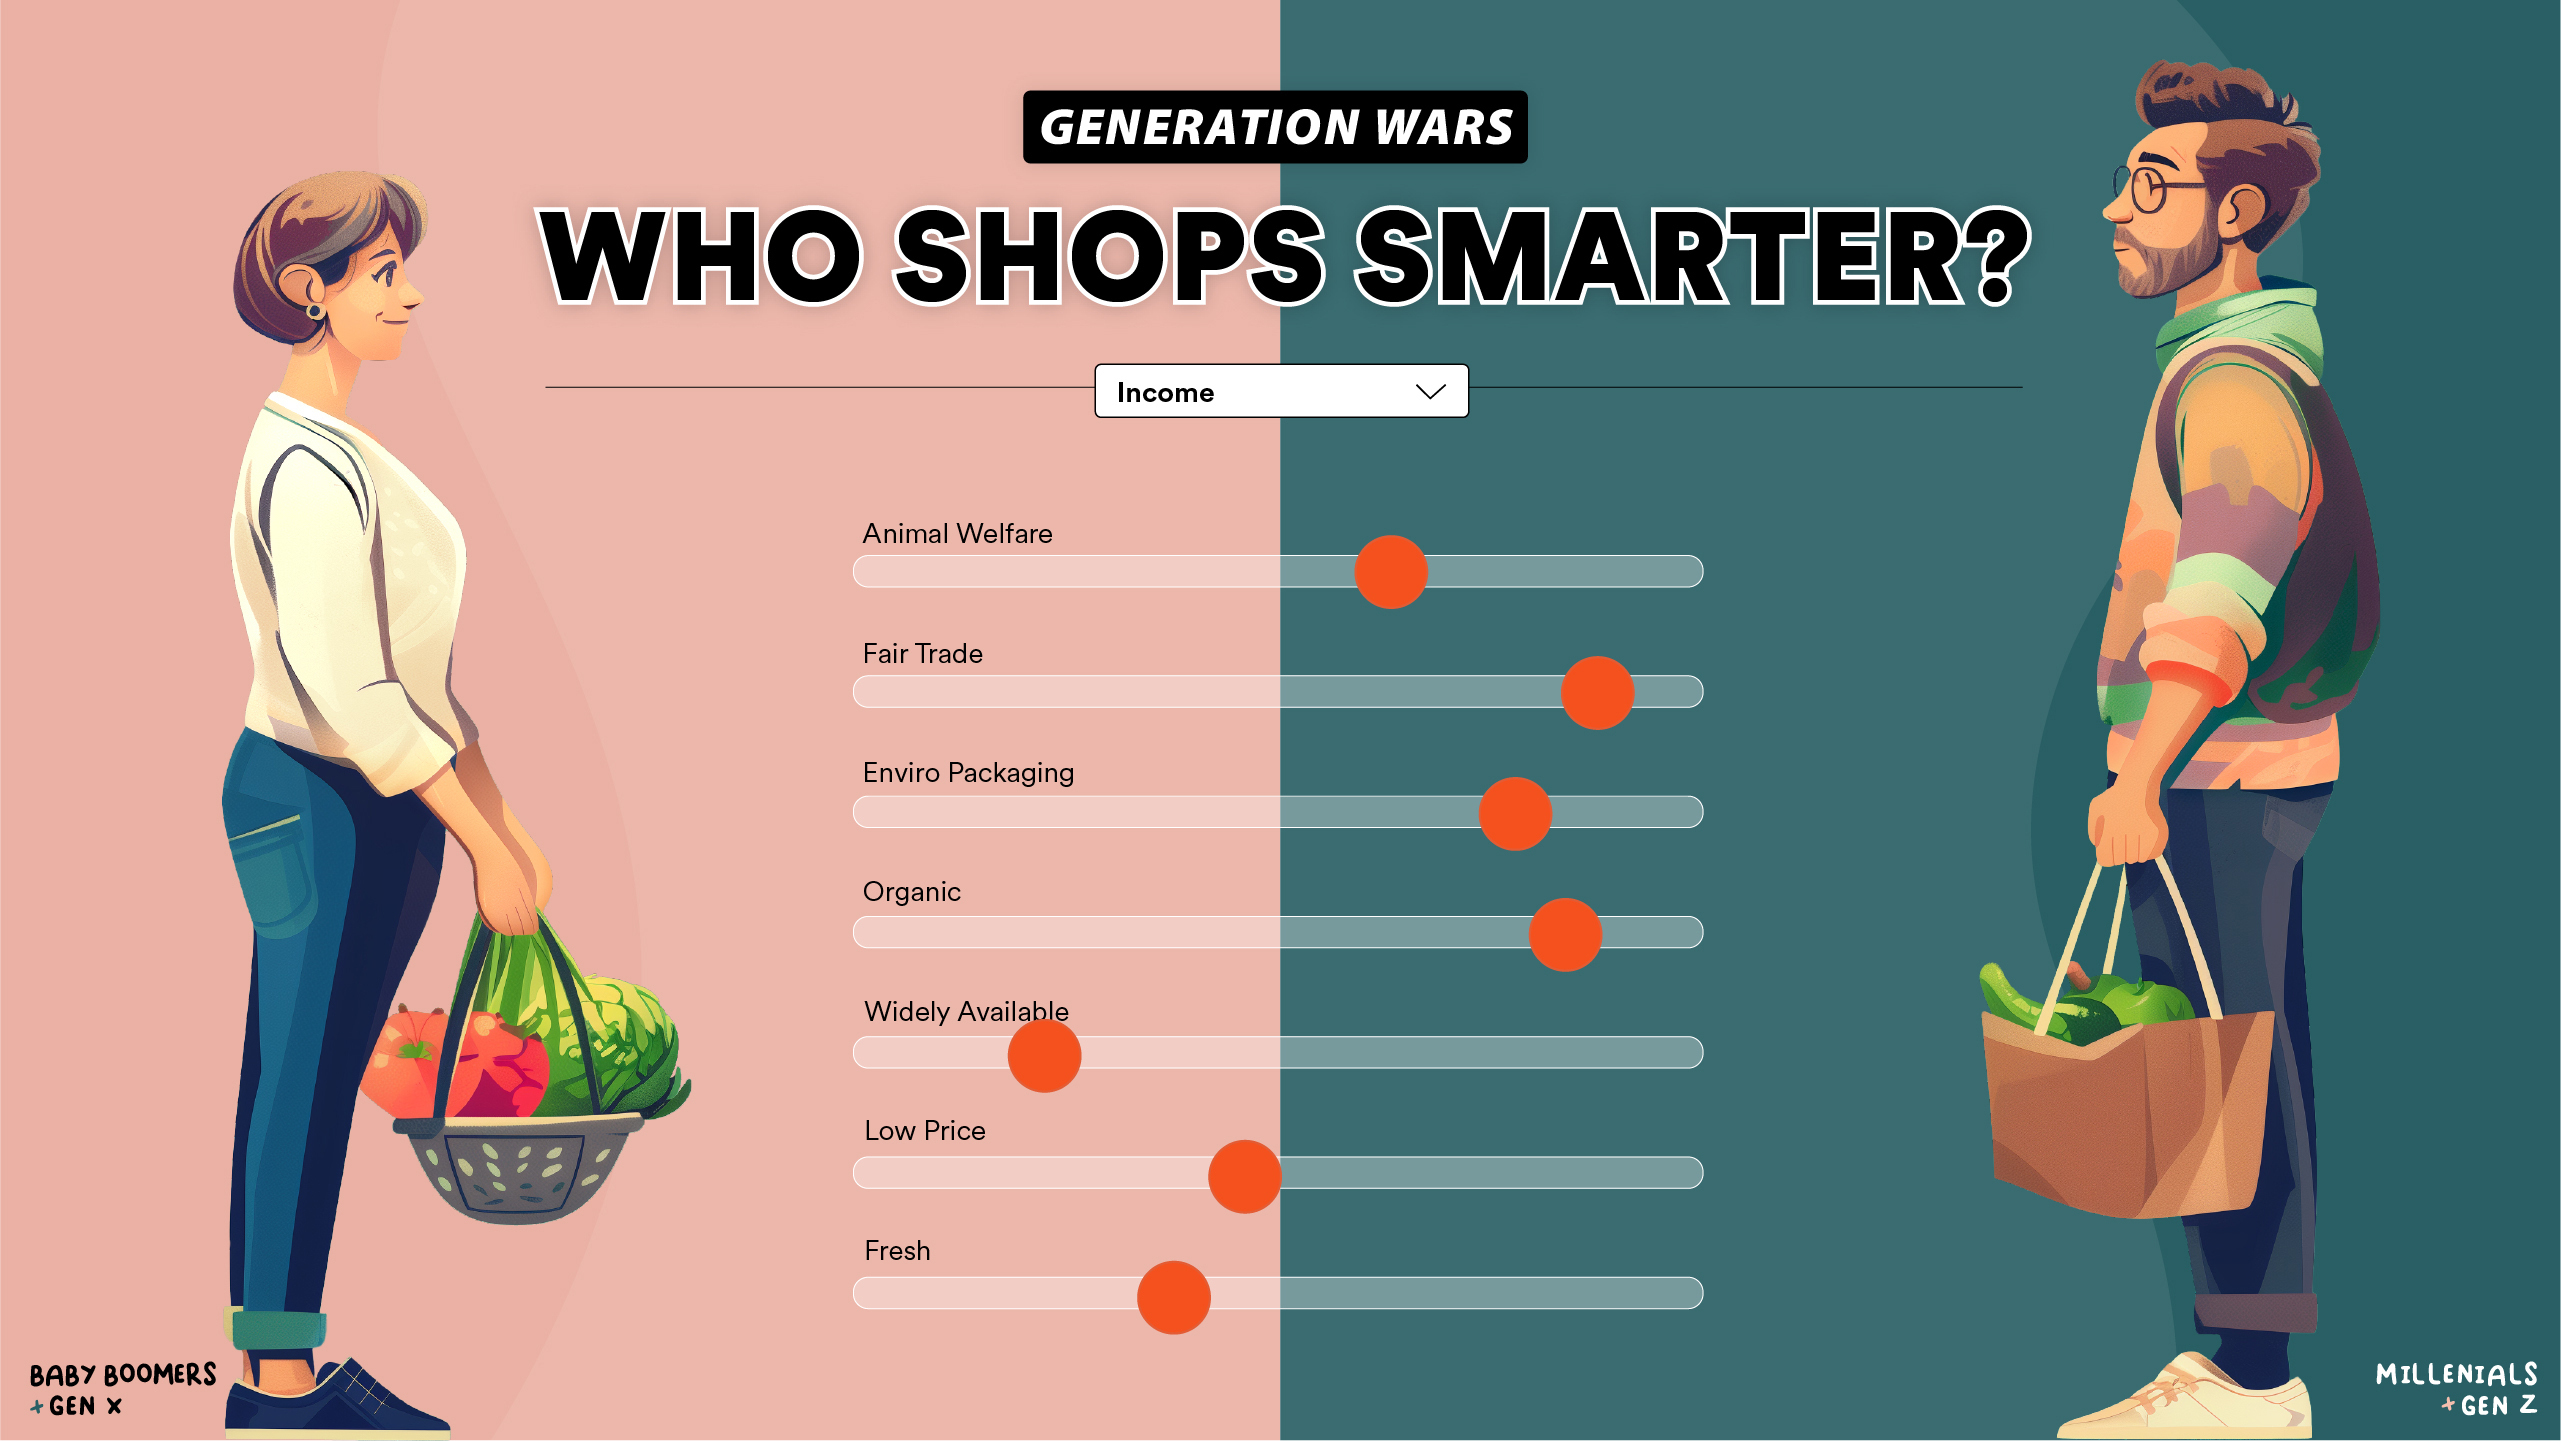
Generation Wars: Who Shops Smarter
Infographic
,
Interactive
Brand Tracking Dashboard
Interactive
,
Multi-Page
,
Tracking
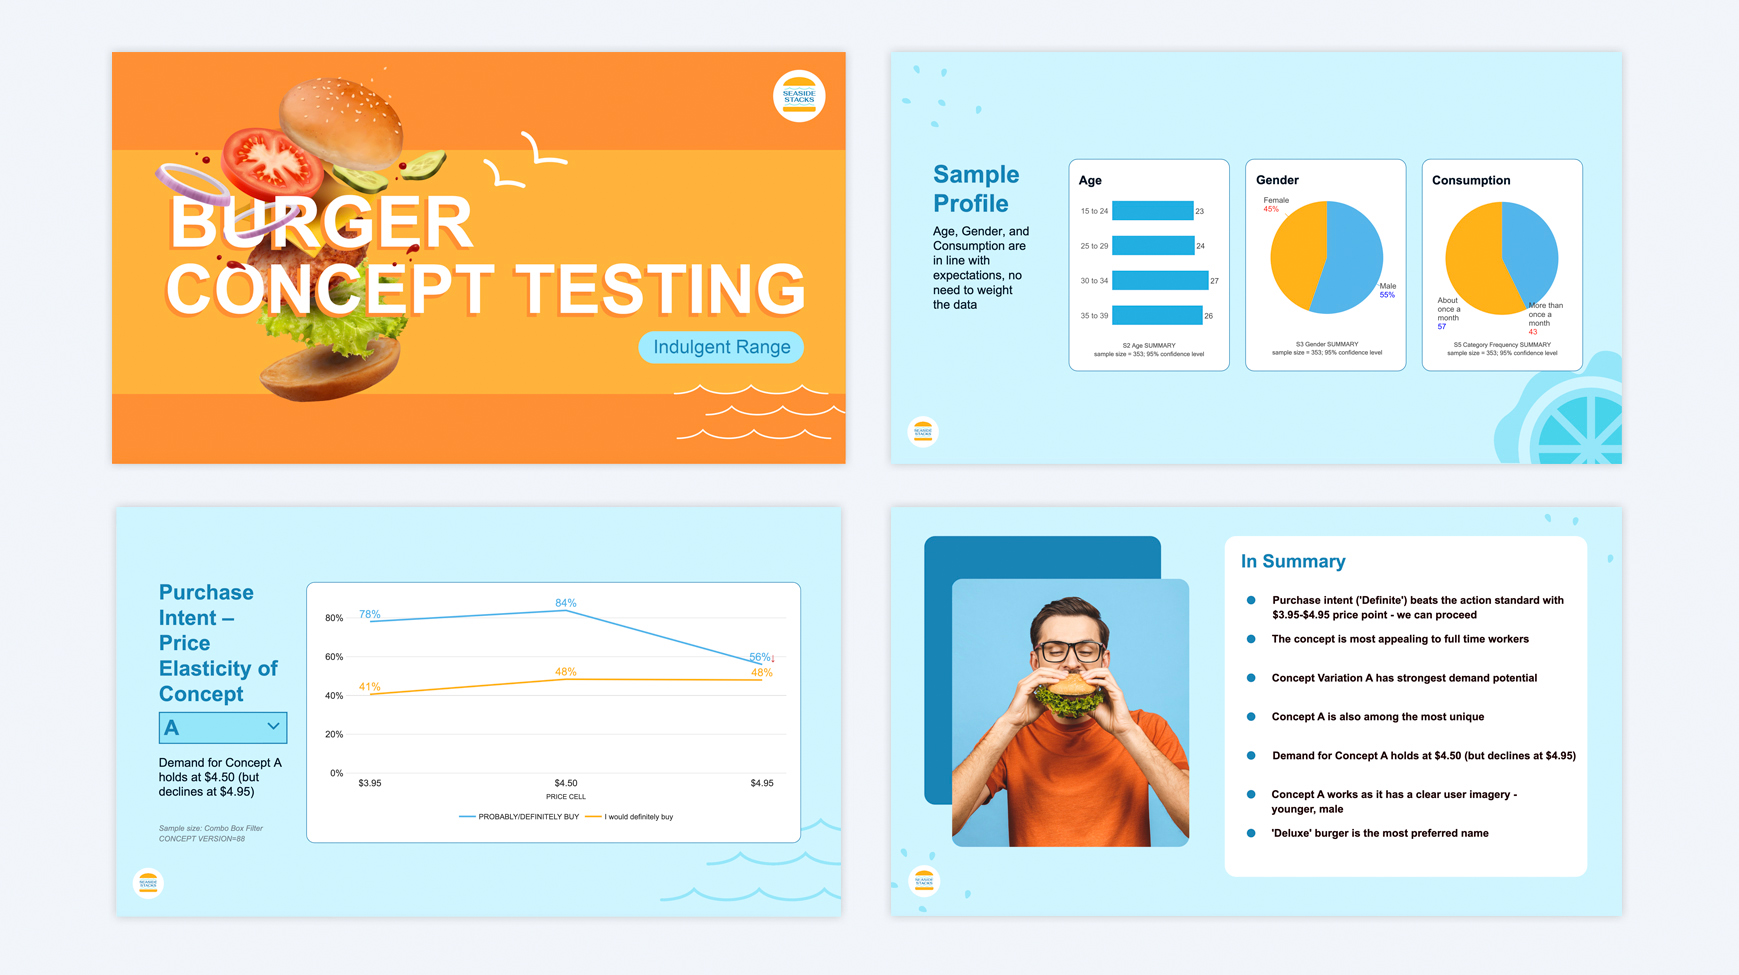
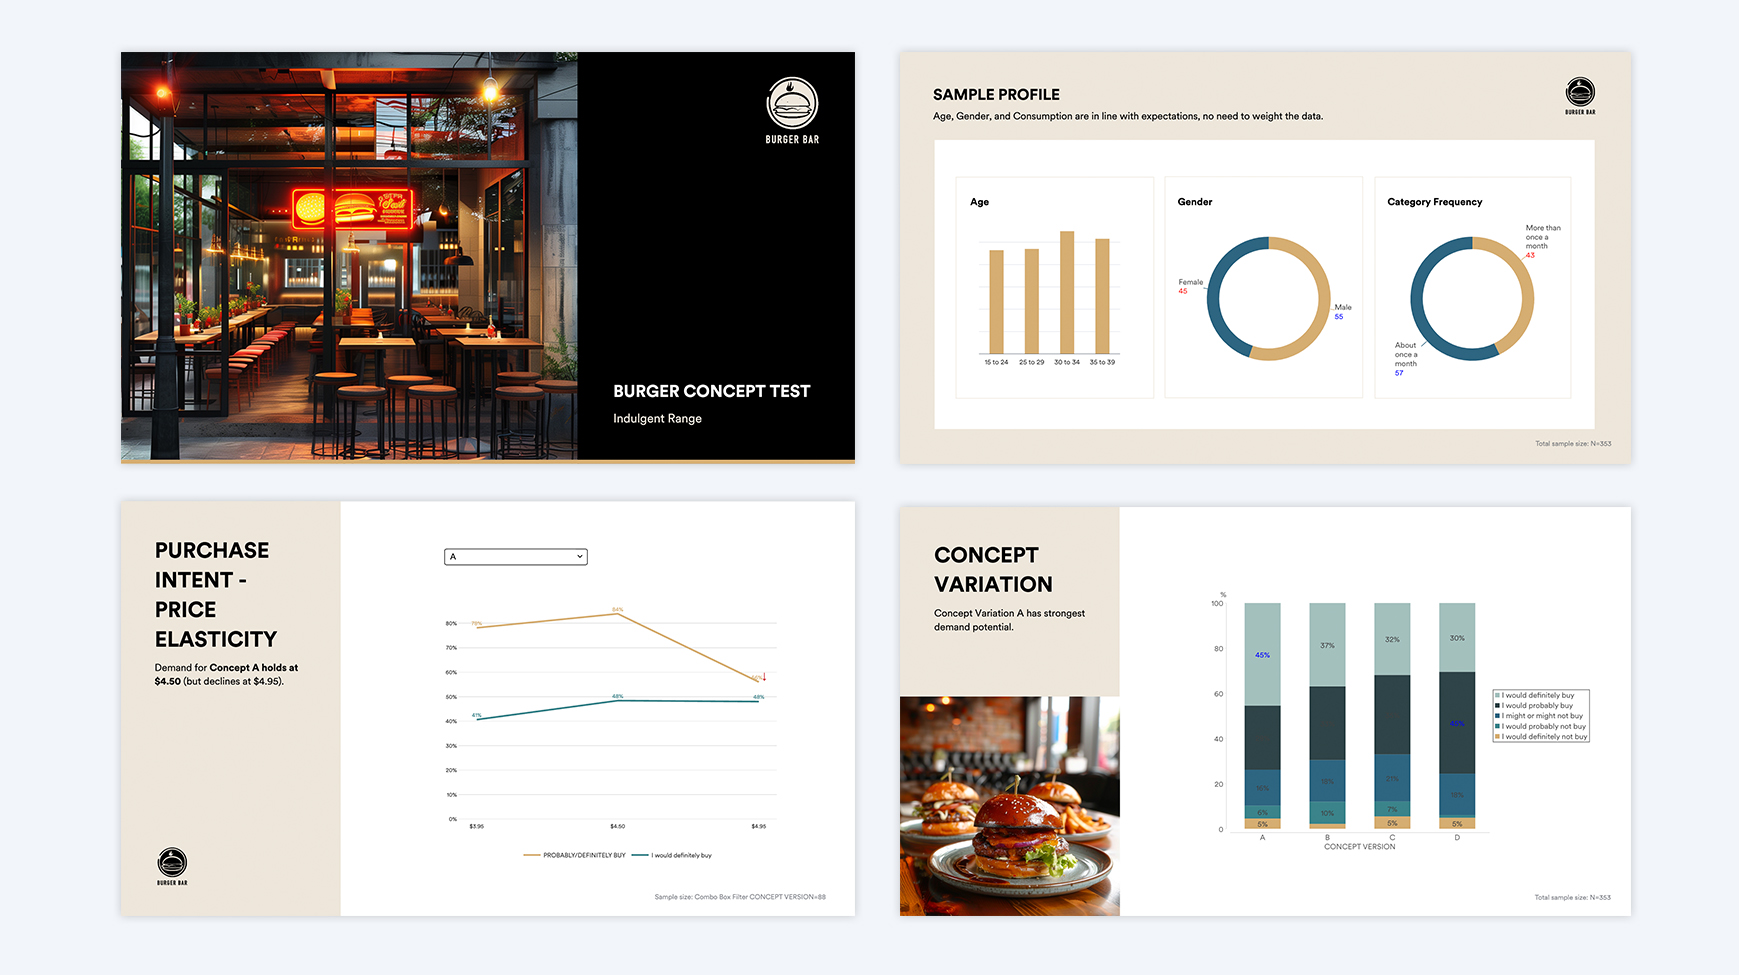
Easily Reproduce a Concept Testing Report
Multi-Page
,
PowerPoint Automation
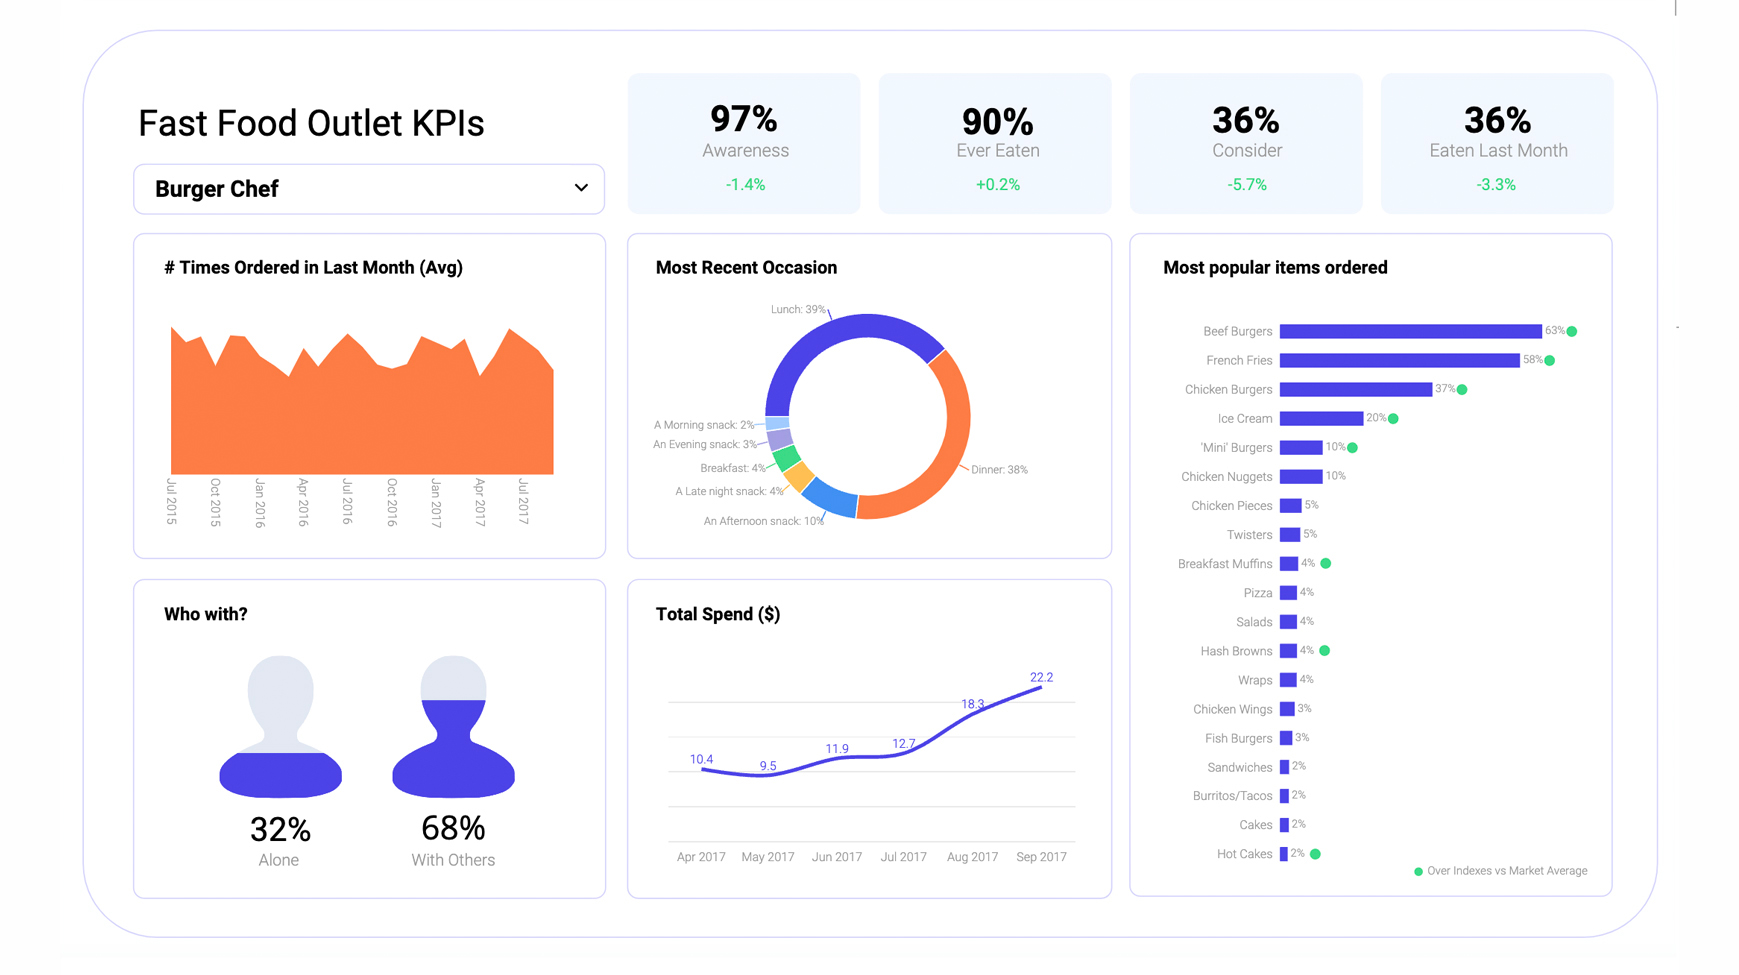
Fast Food Outlet KPIs Dashboard
Interactive
,
Tracking
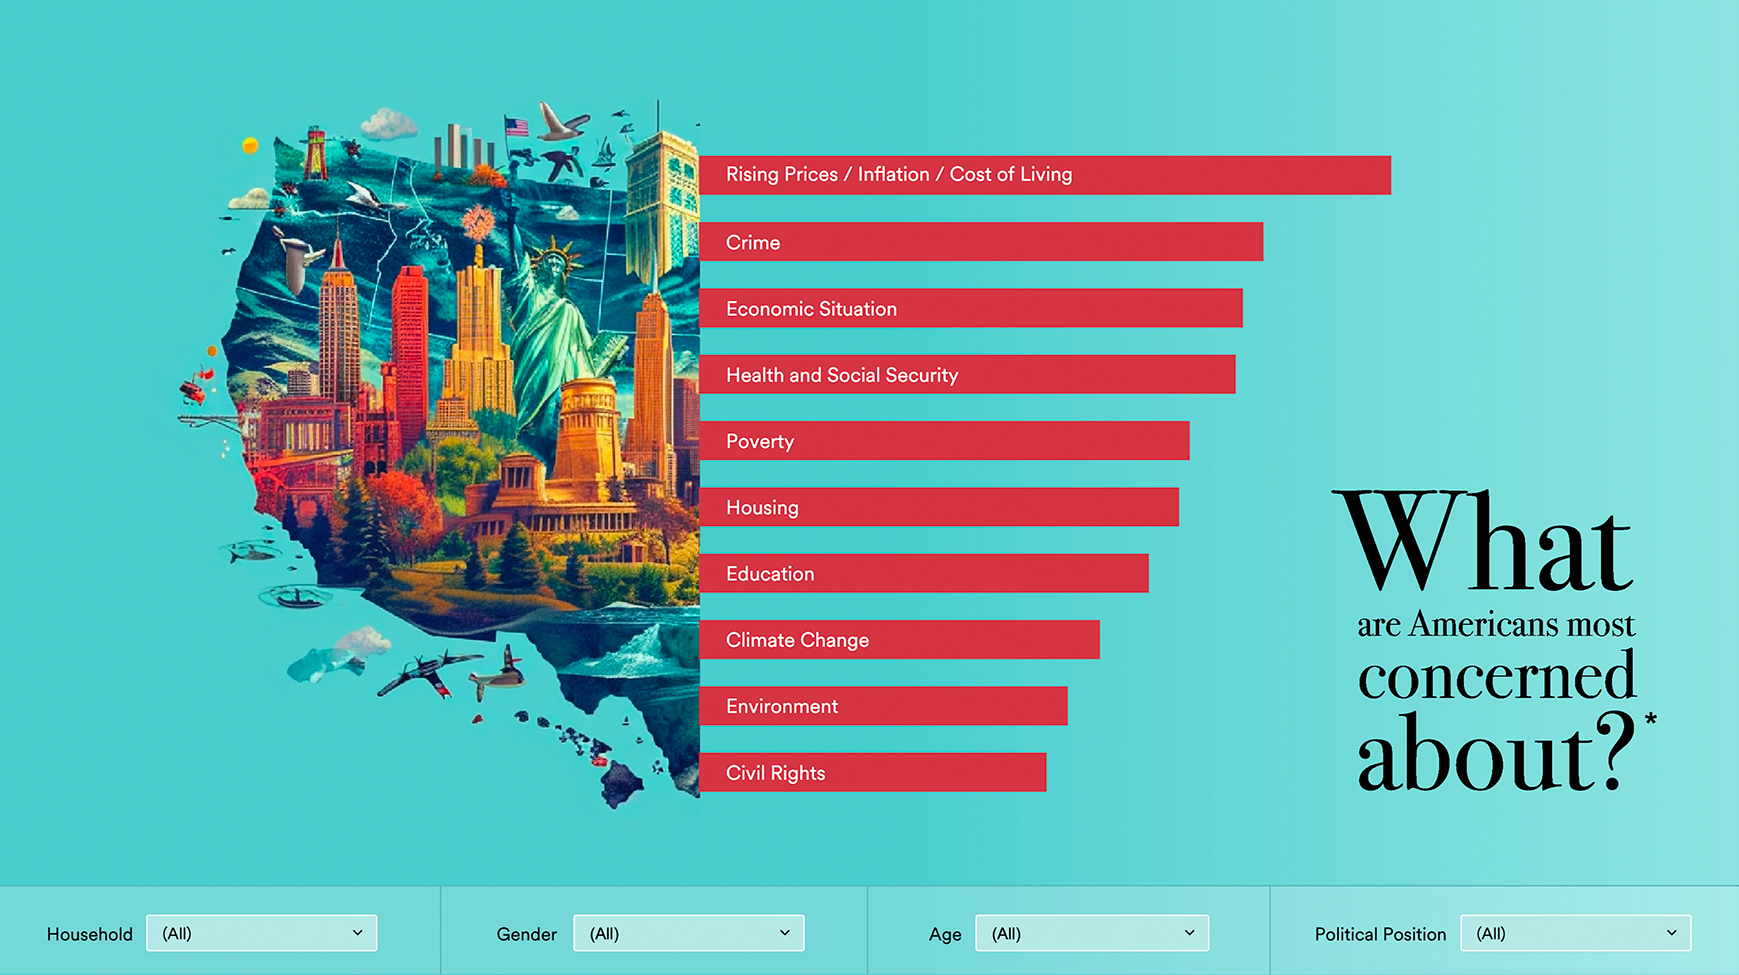
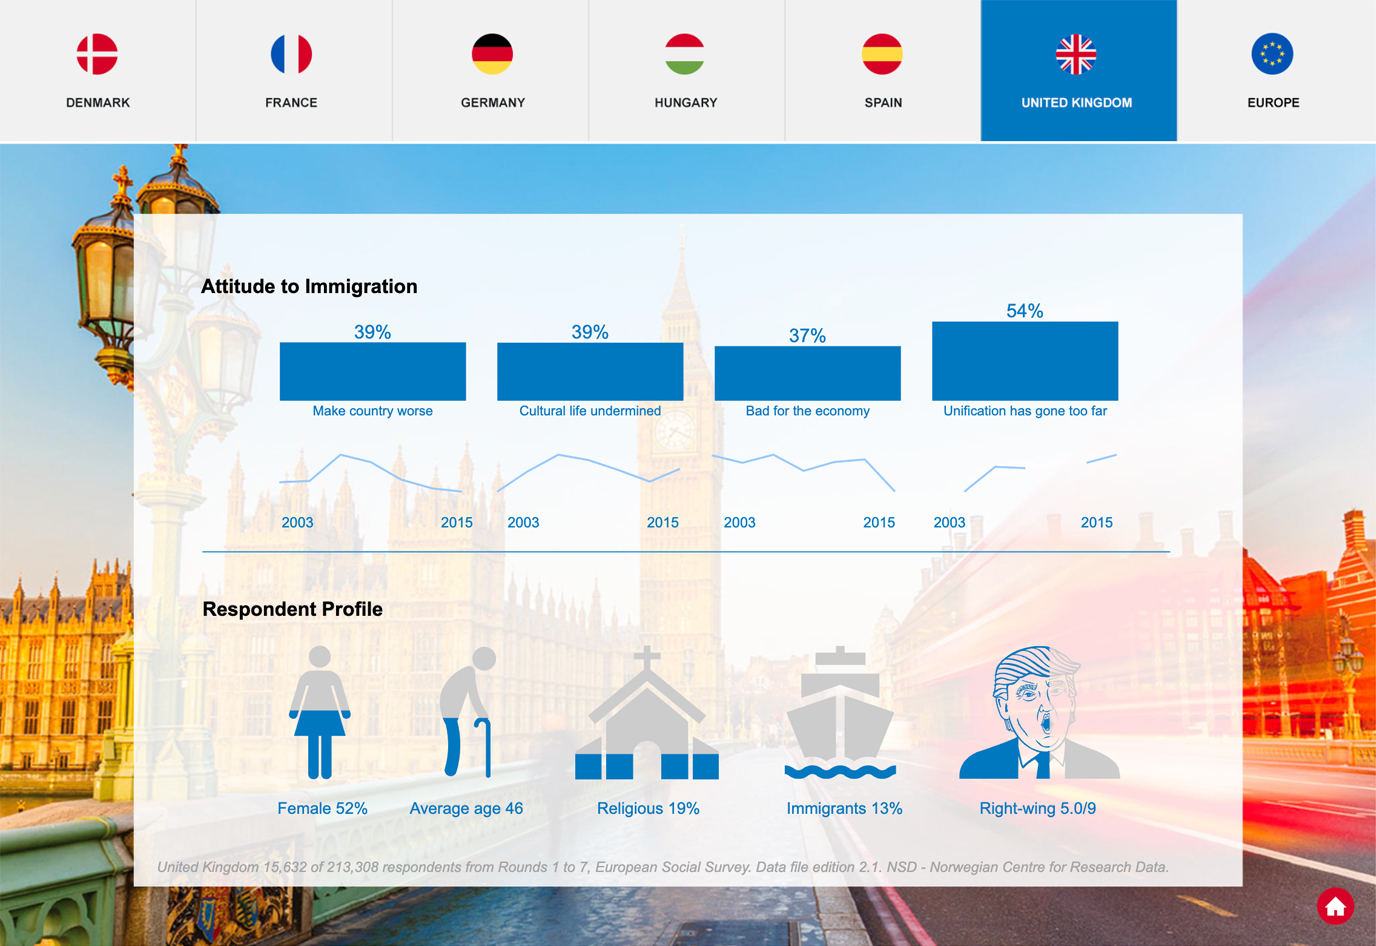
Concerns of America Dashboard
Infographic
,
Interactive
Concept Testing with Automated Reporting
Multi-Page
,
PowerPoint Automation
Storytelling Dashboard
Infographic
,
Interactive
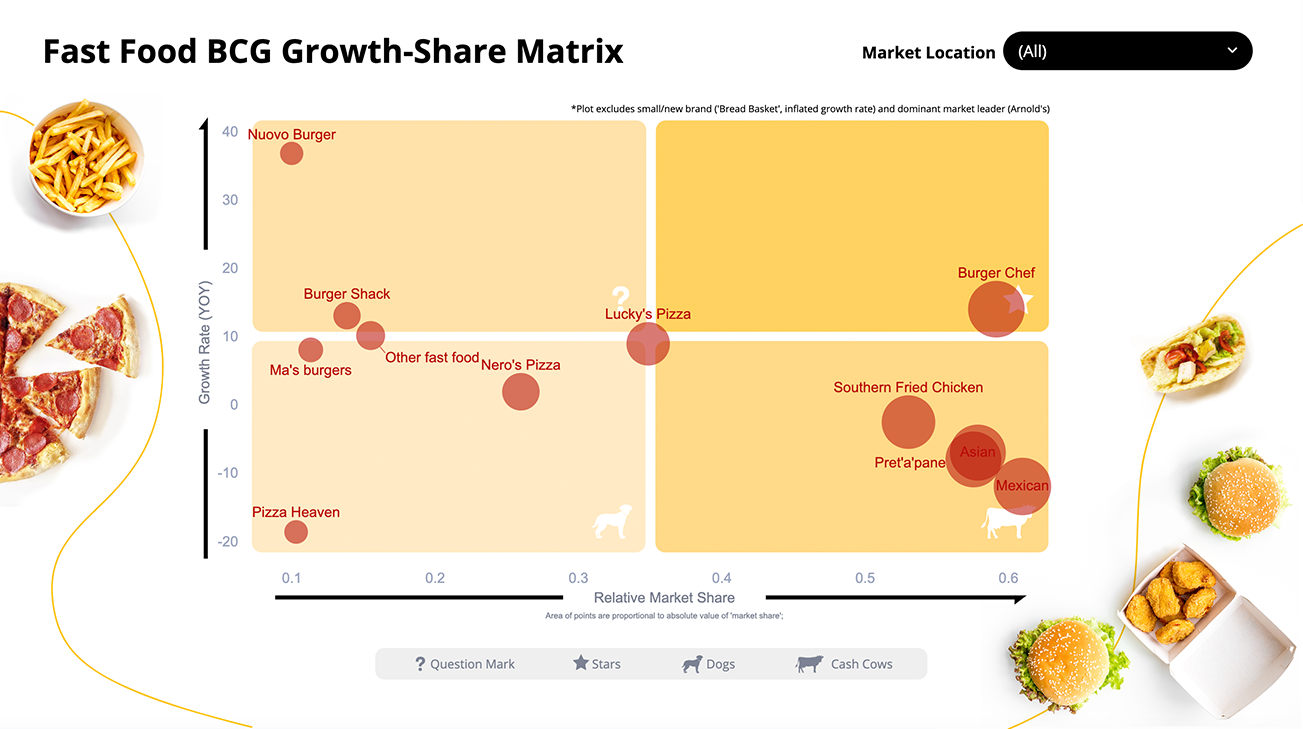
BCG Growth Share Matrix
Interactive
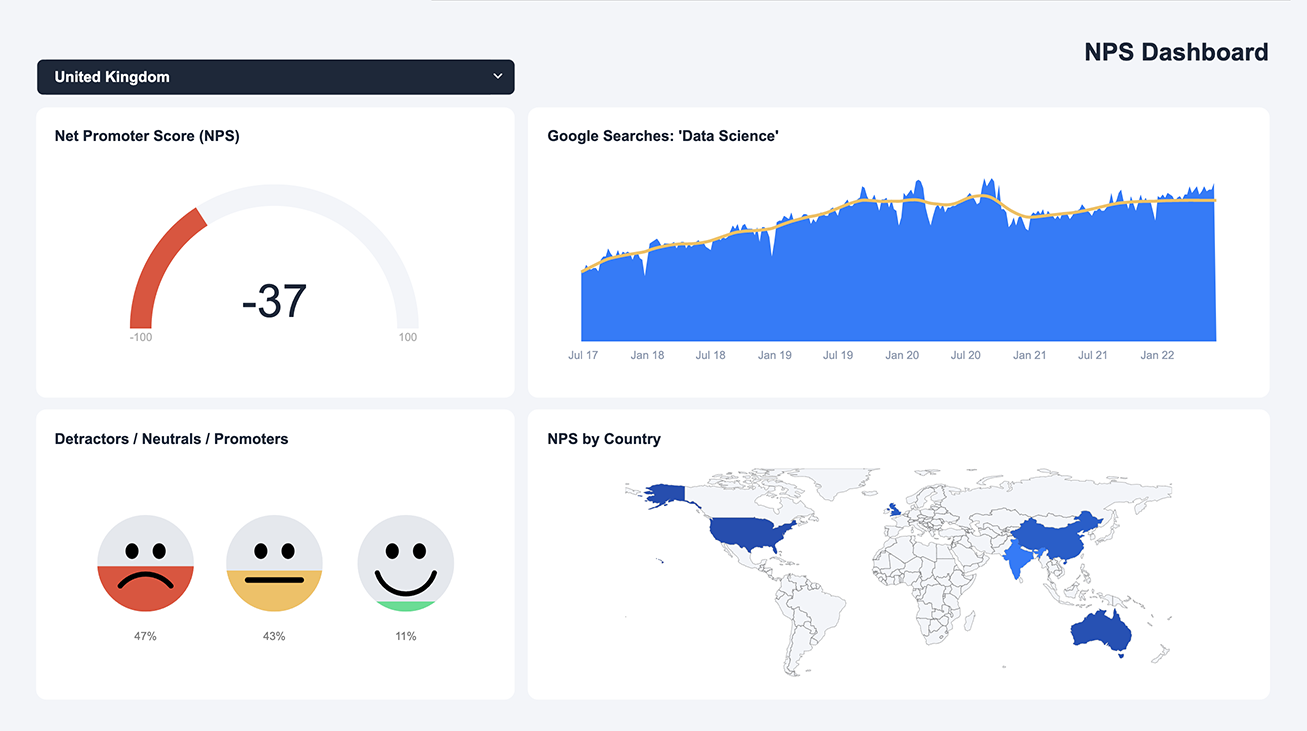
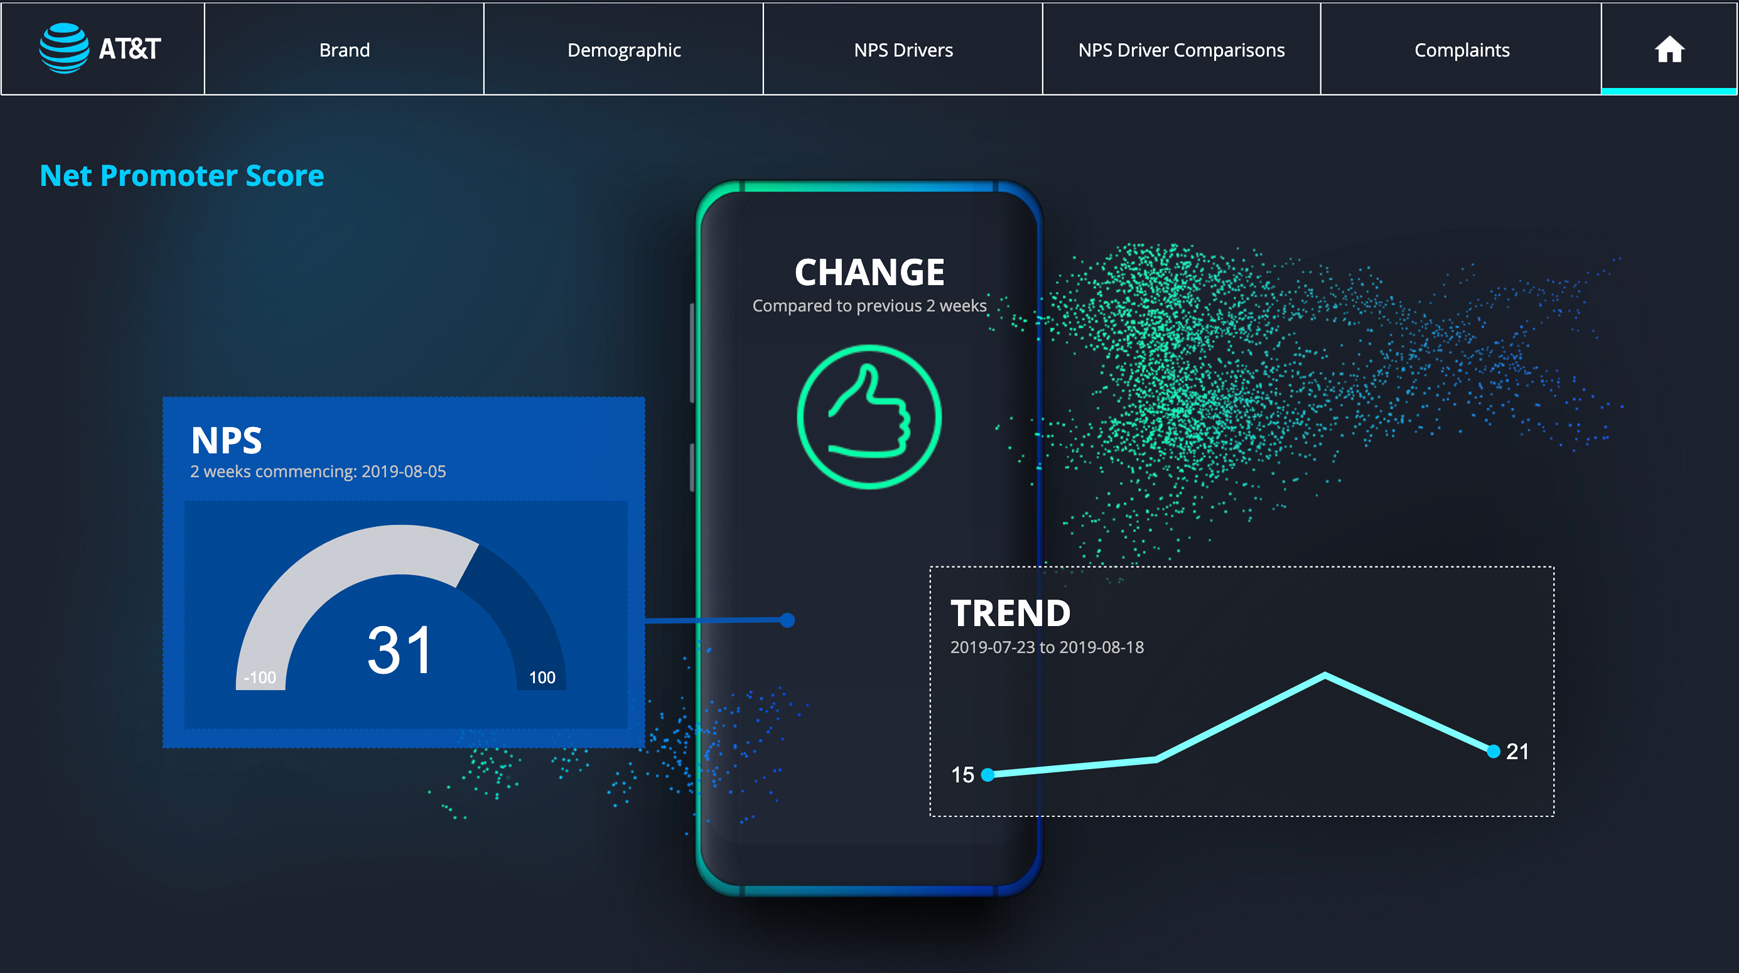
NPS Dashboard
Interactive
,
Tracking
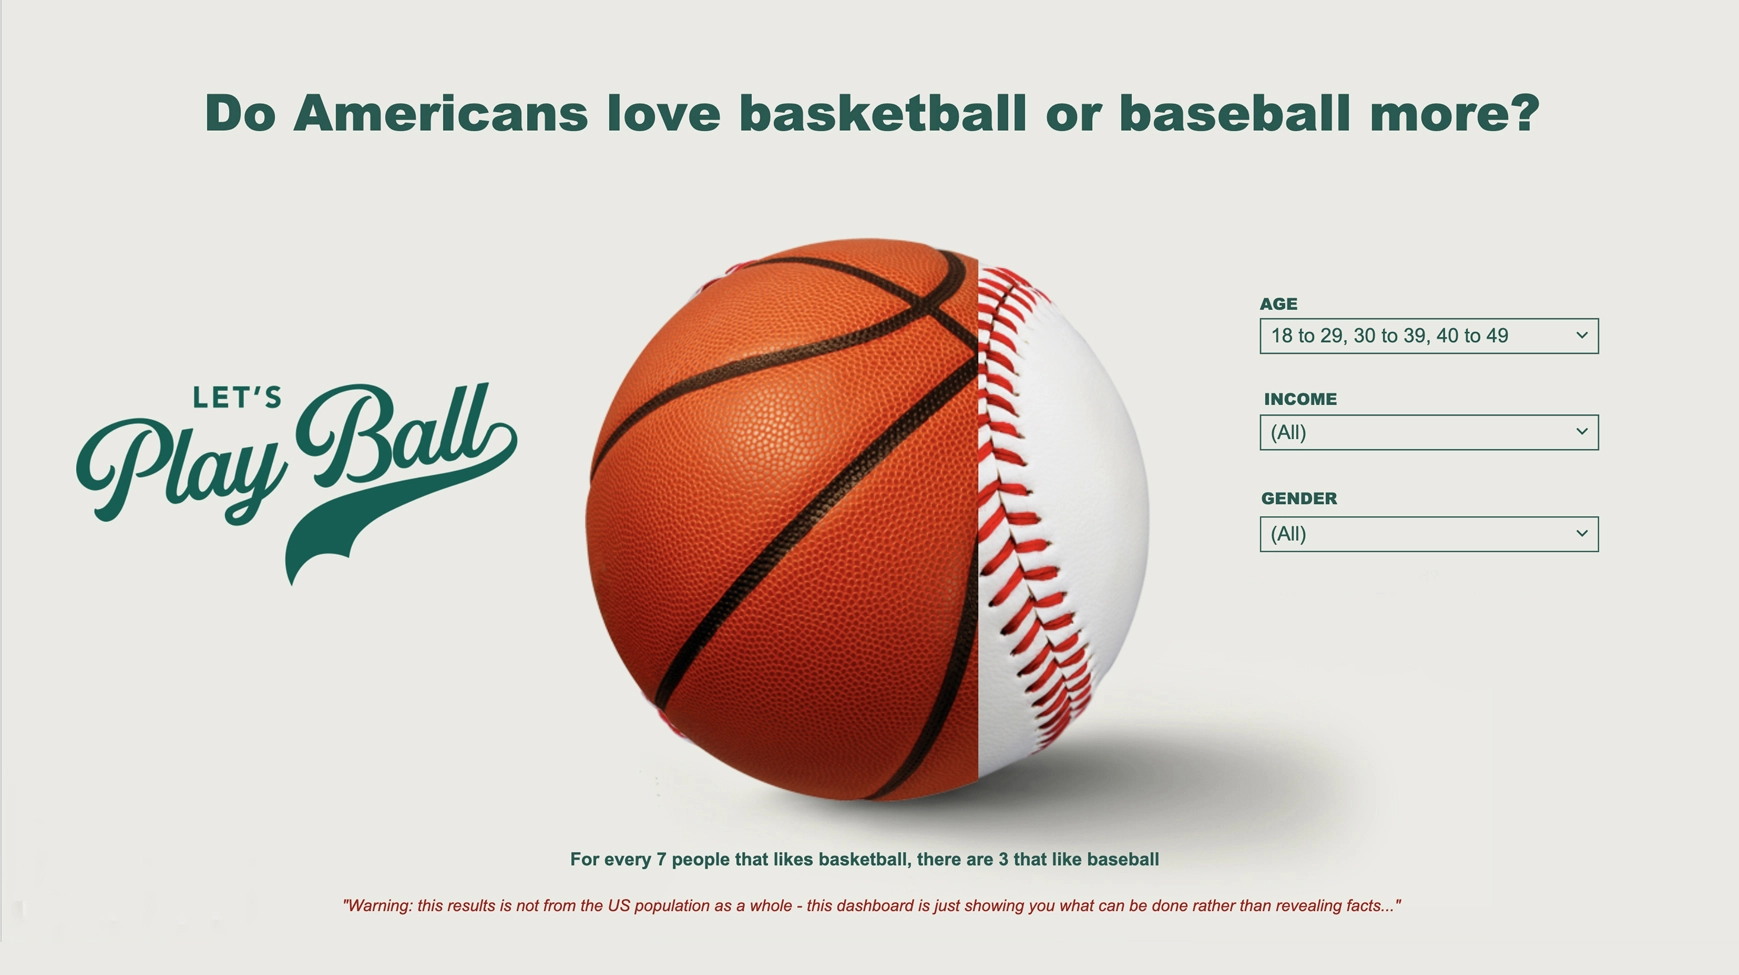
Basketball or Baseball Dashboard
Infographic
,
Interactive
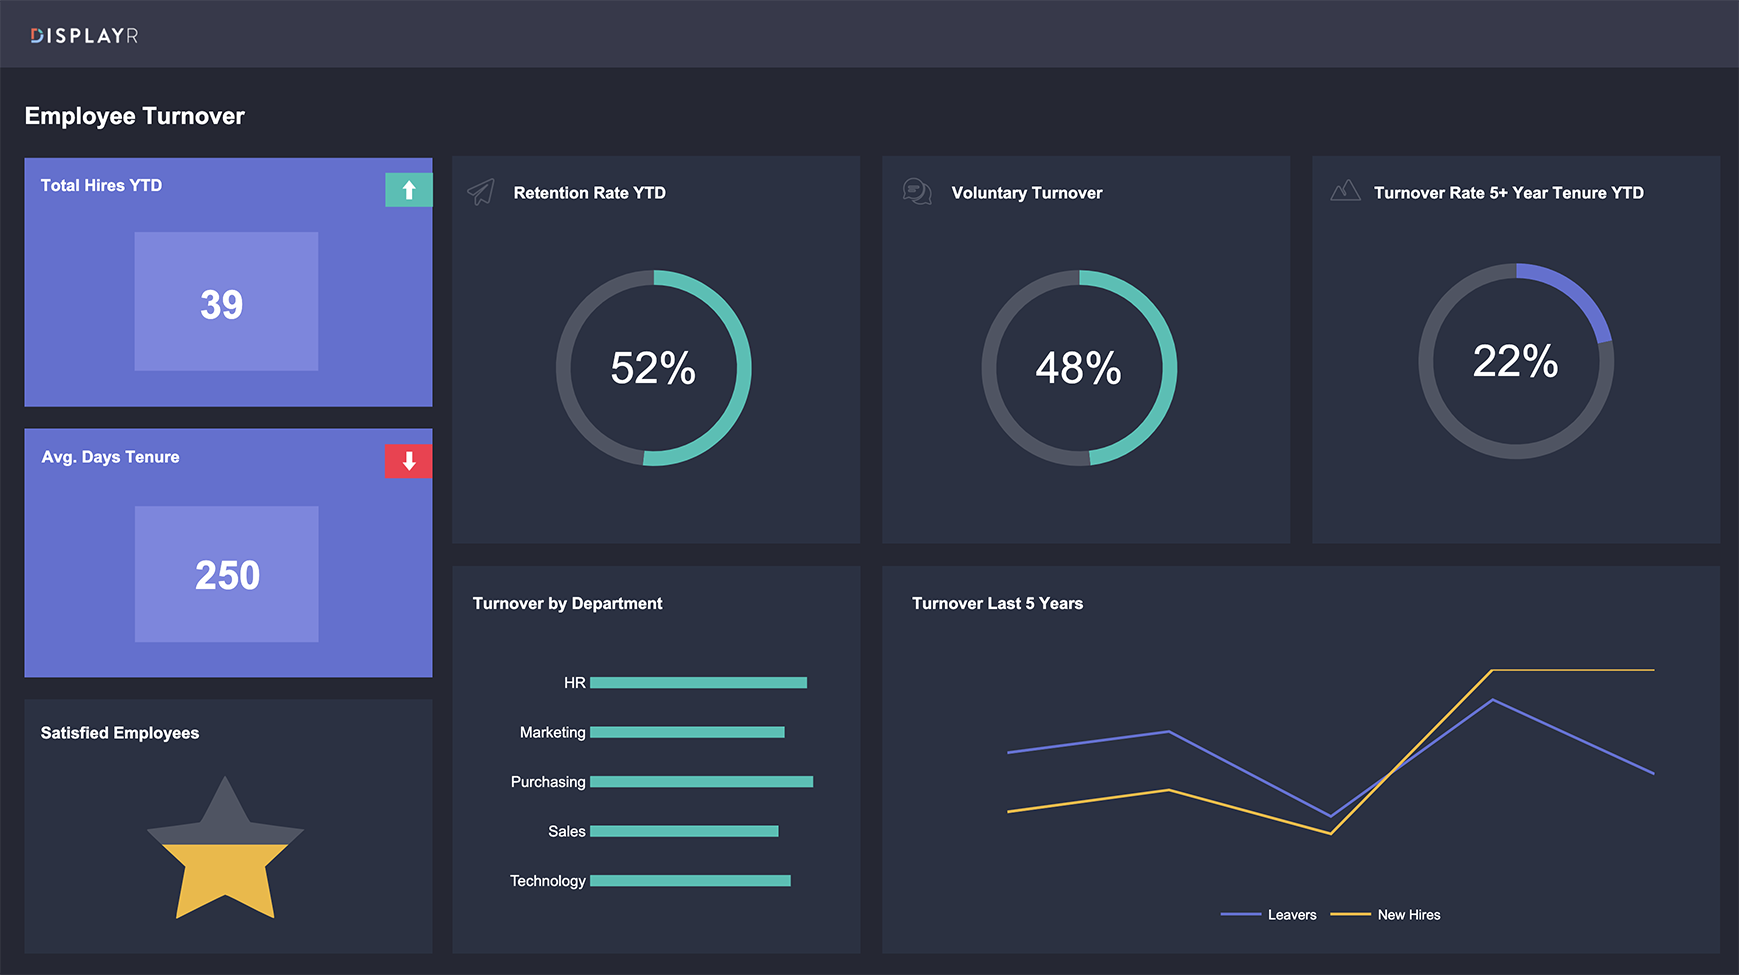
KPI Dashboard – Employee Turnover
Interactive
,
Tracking
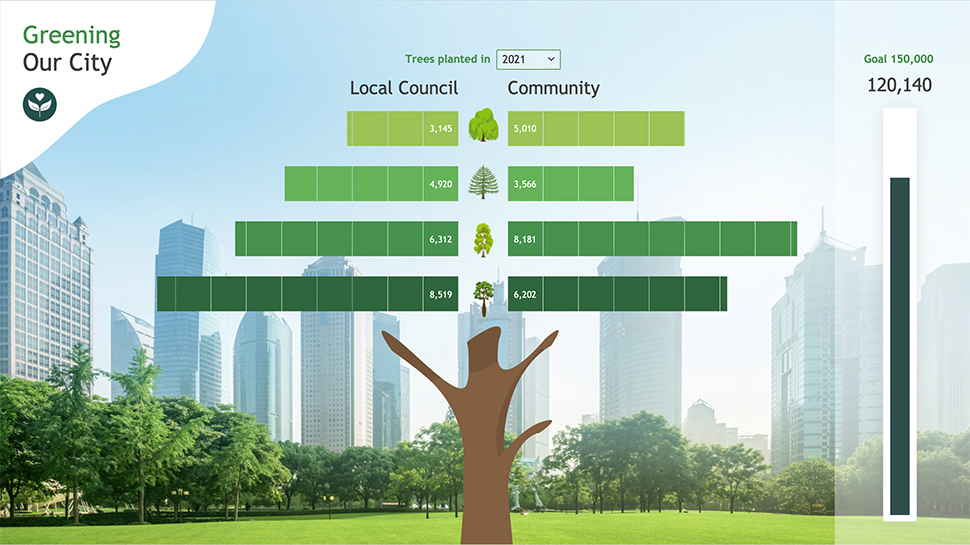
Greening Our City Dashboard
Infographic
,
Interactive
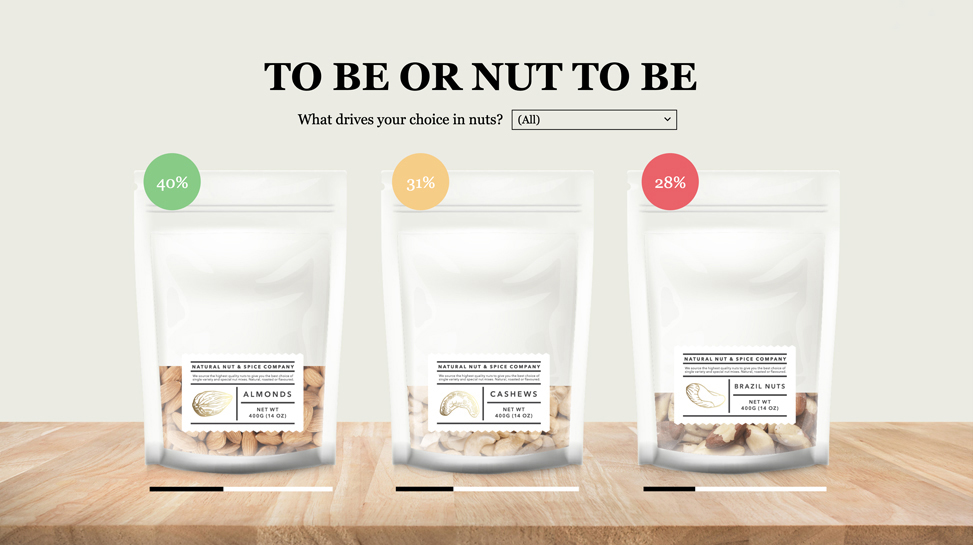
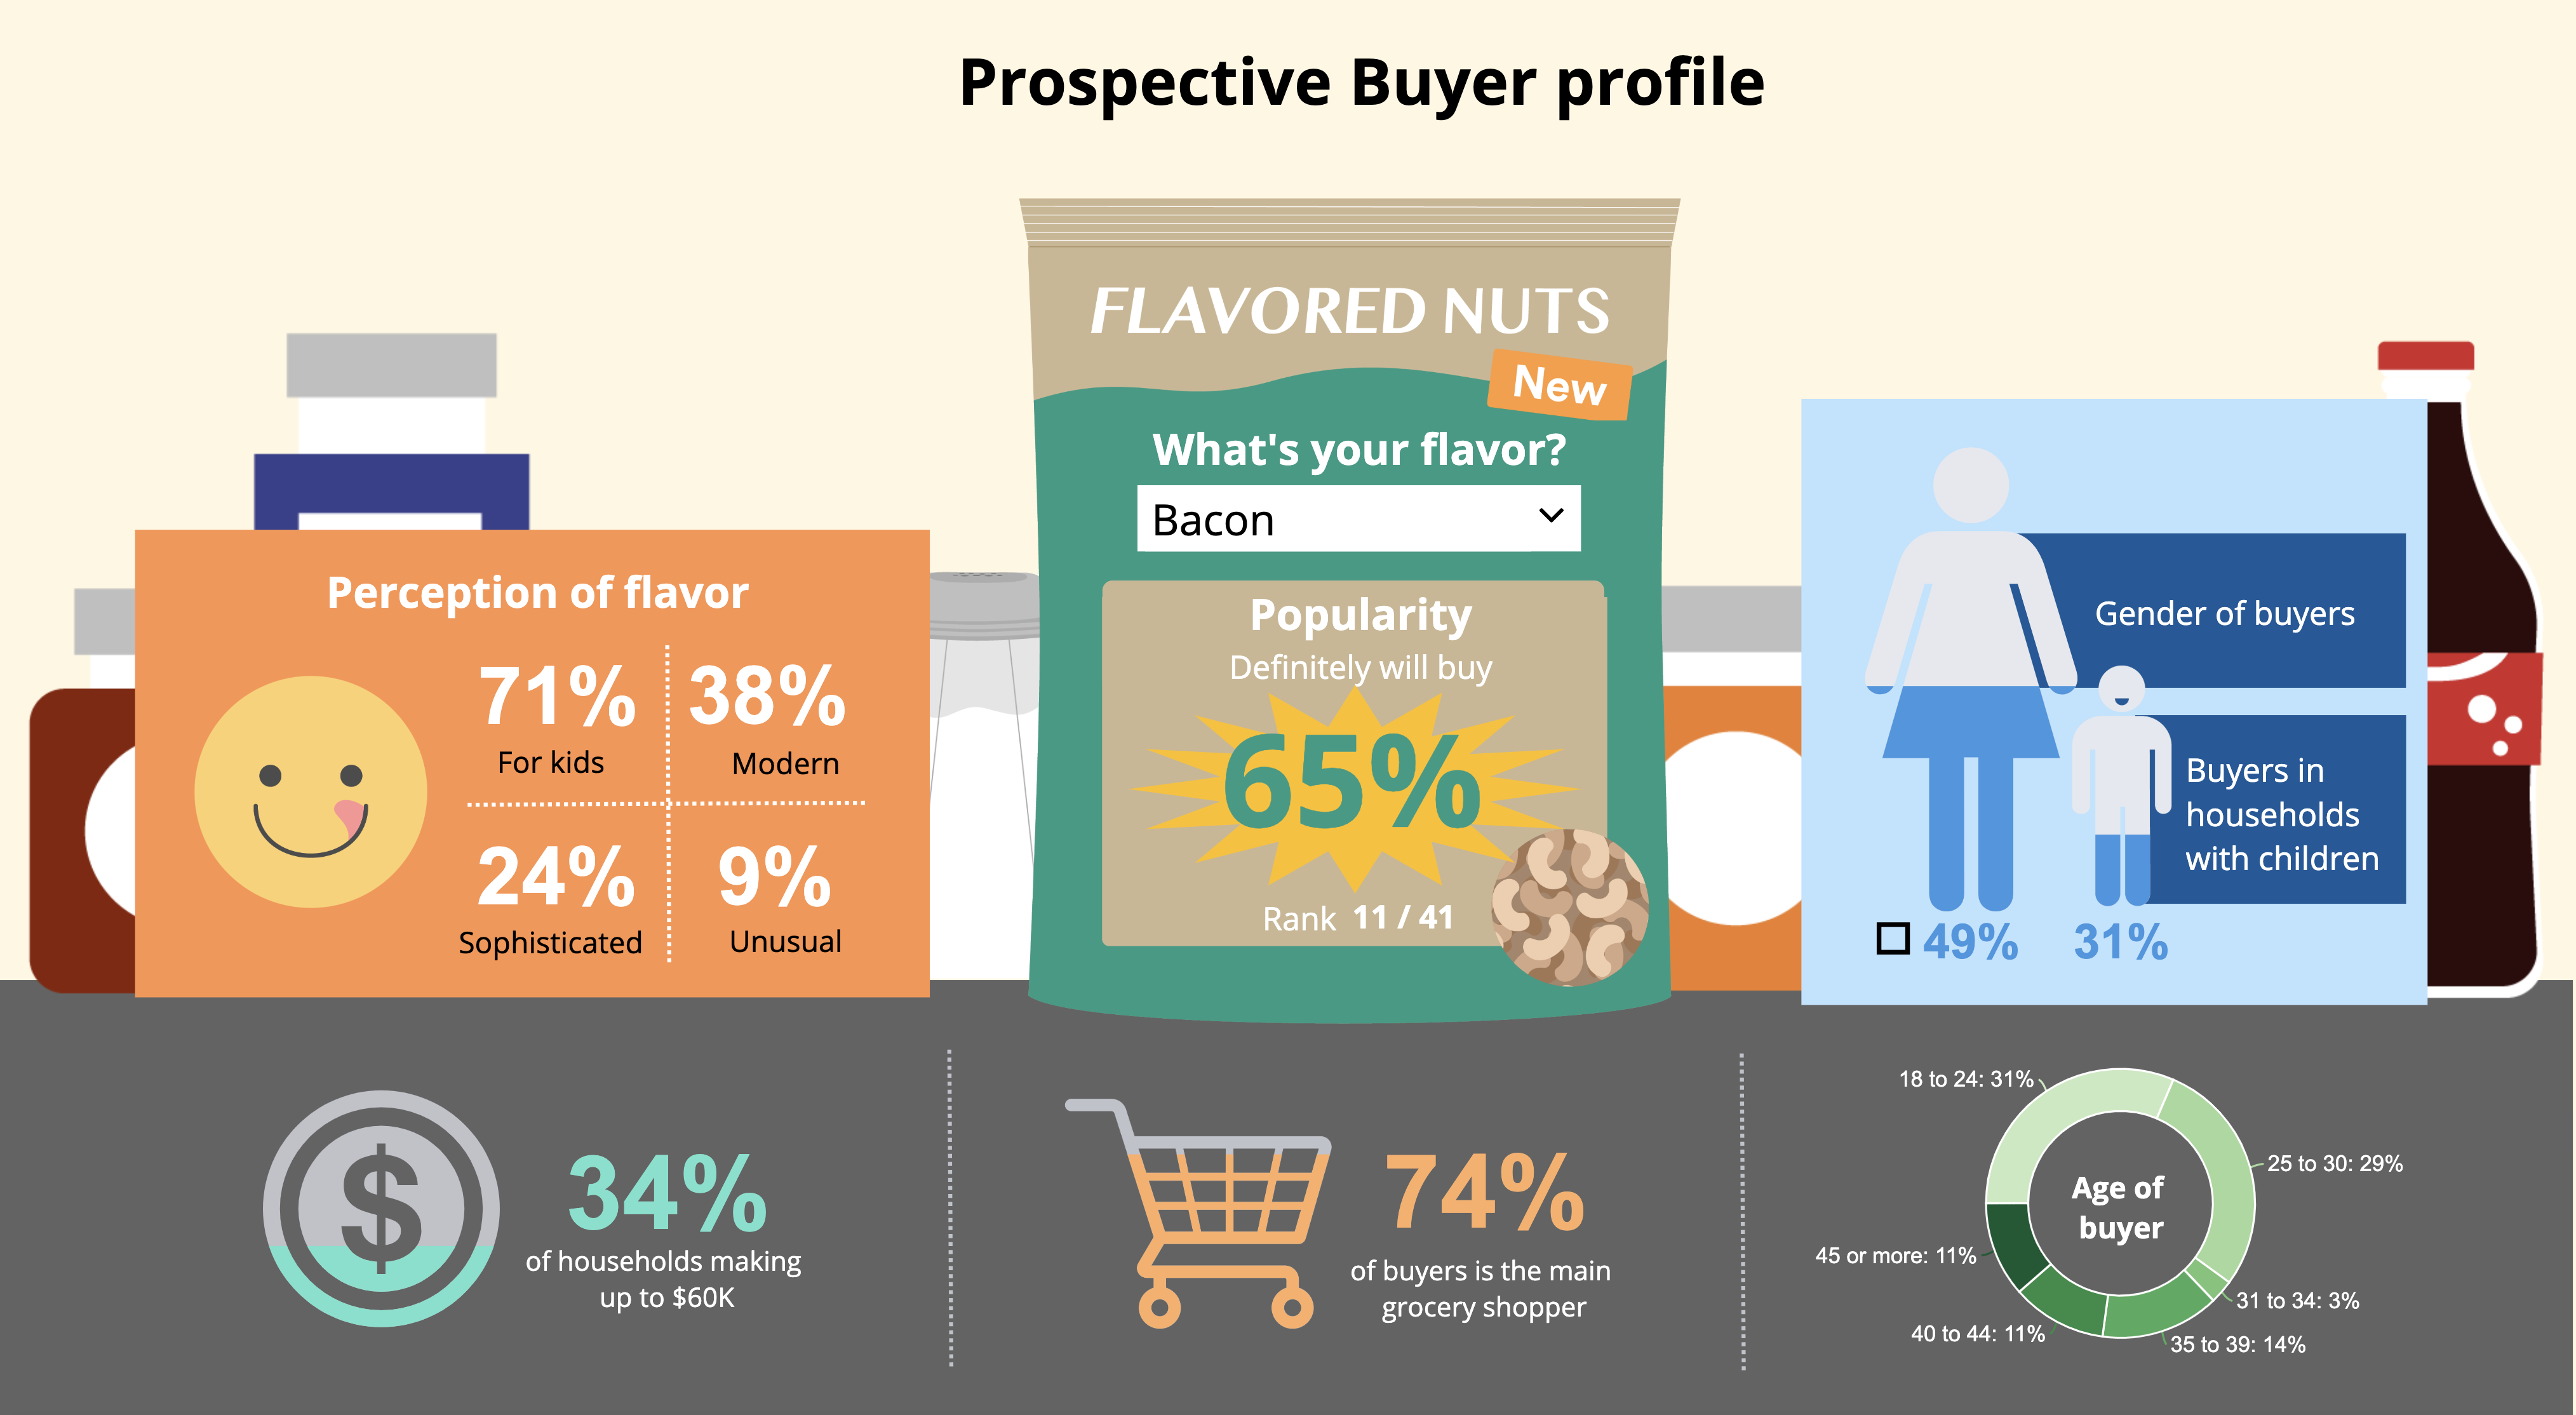
Product Preference Dashboard
Infographic
,
Interactive
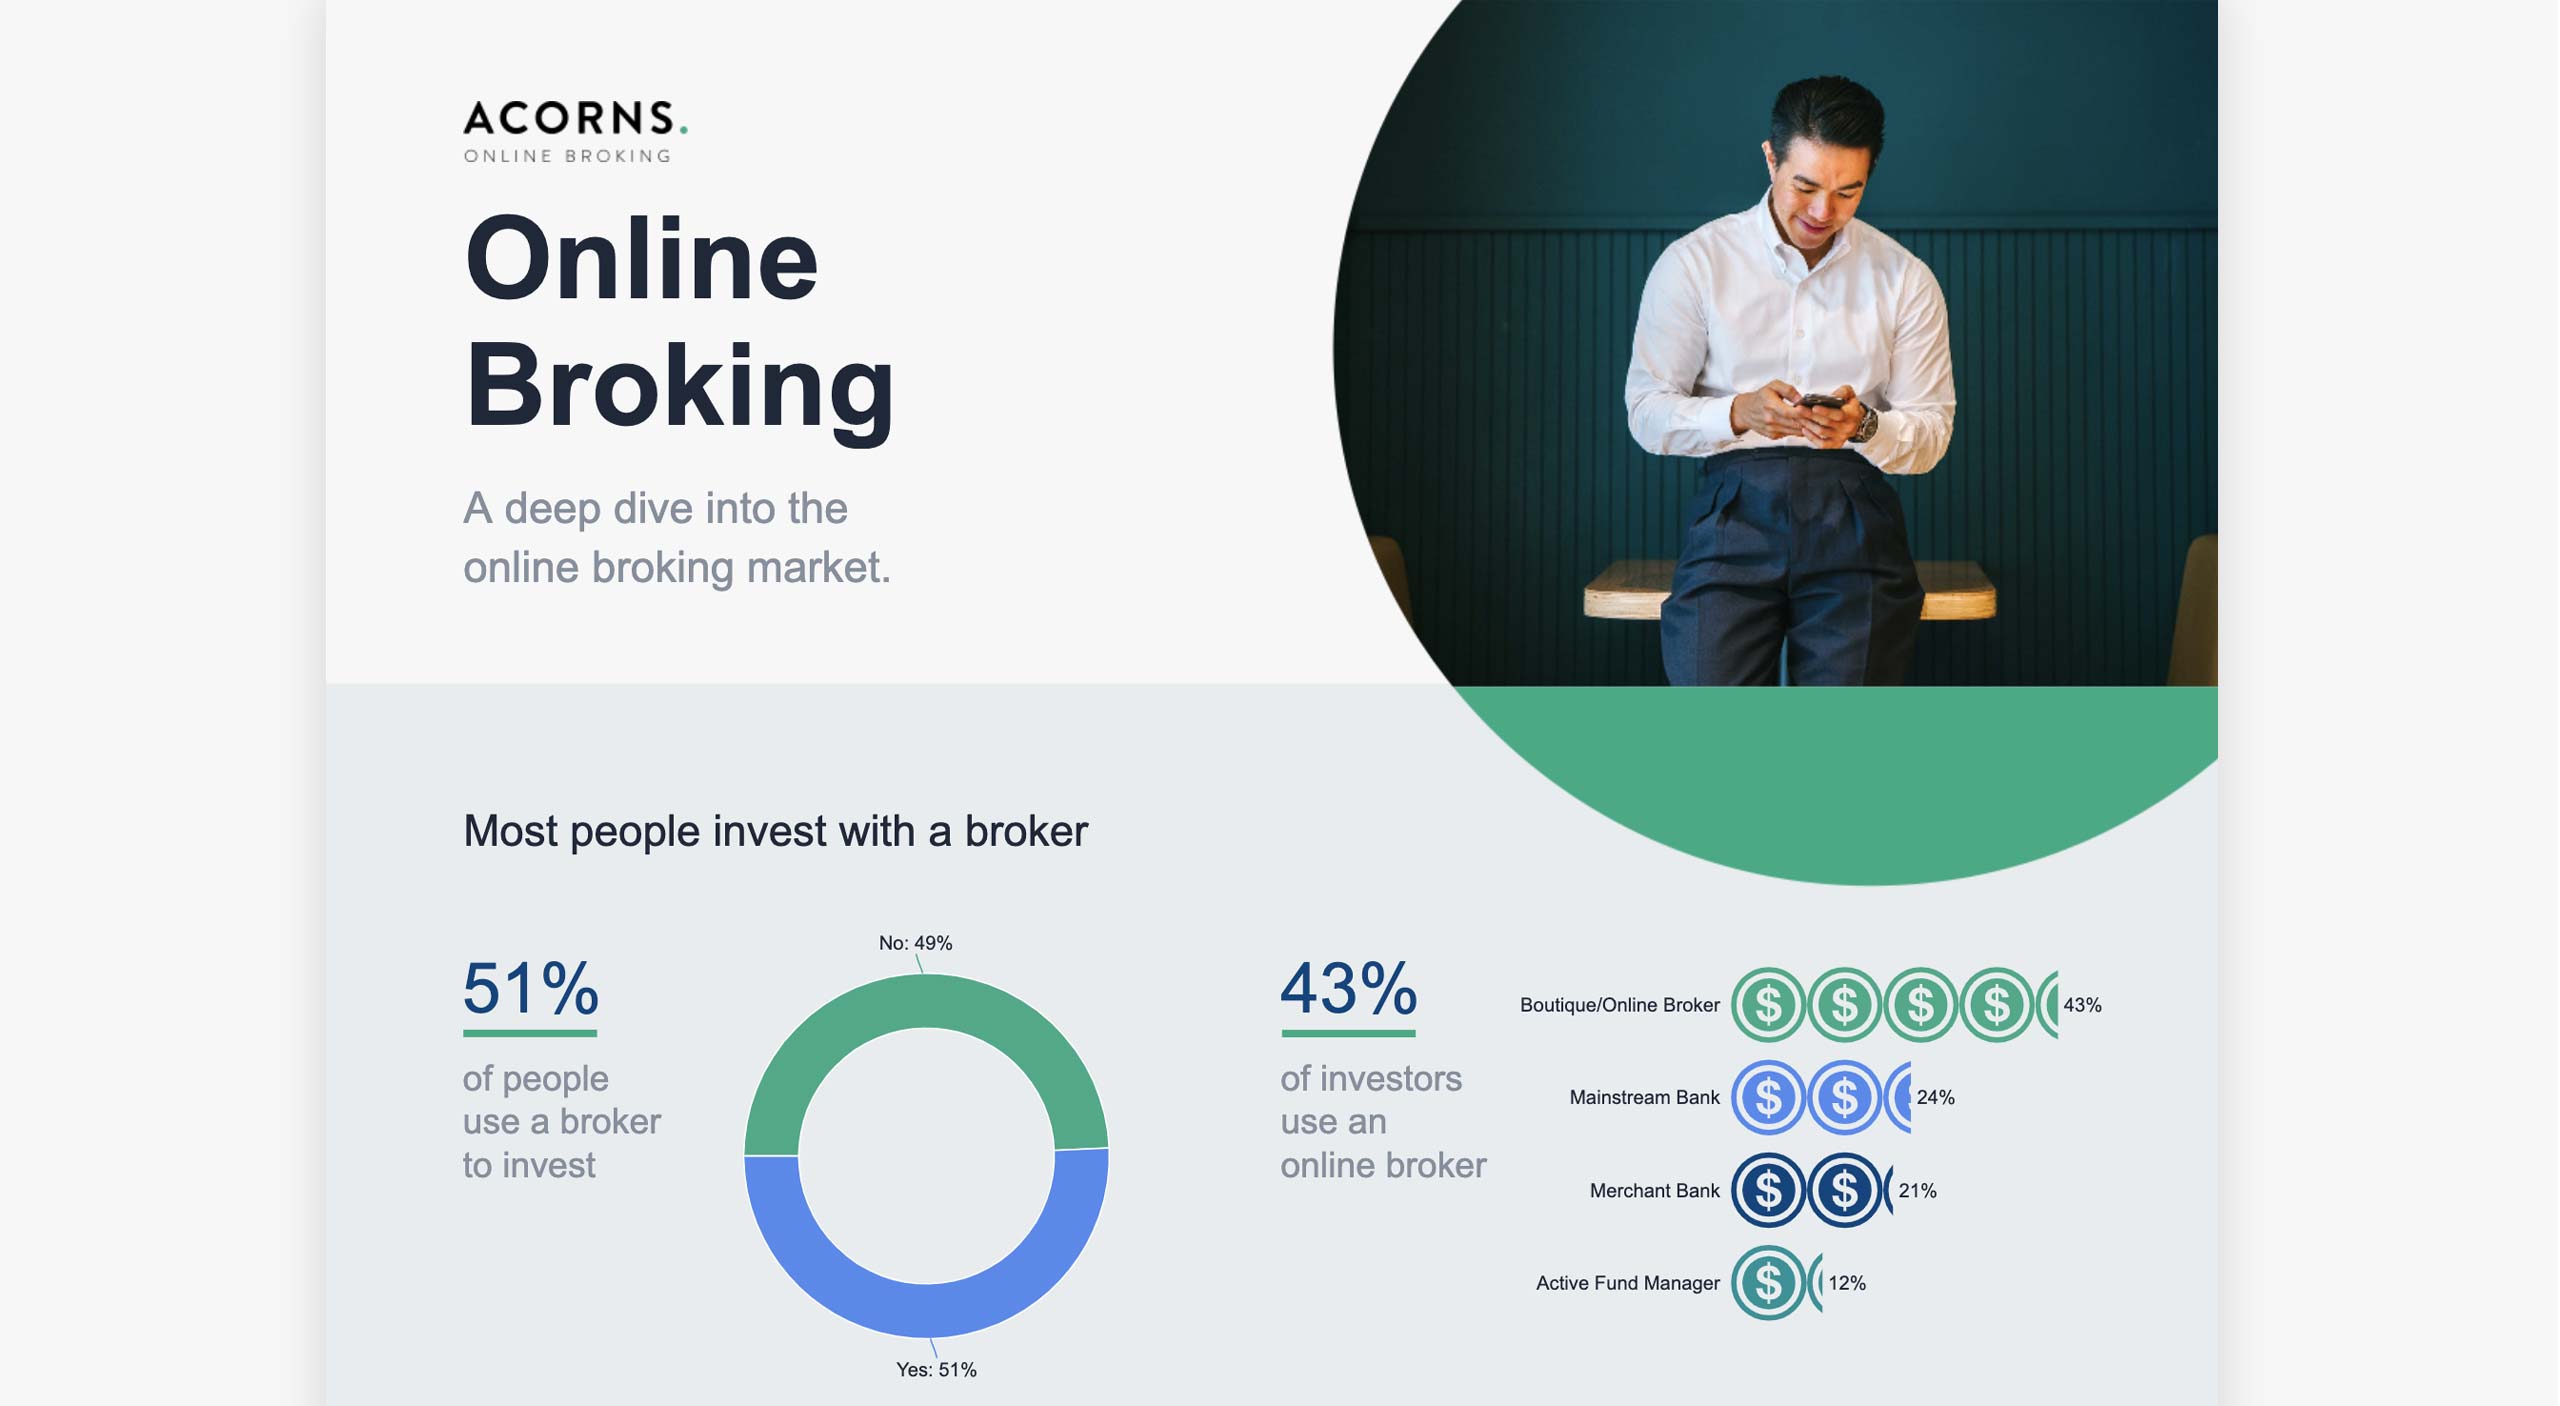
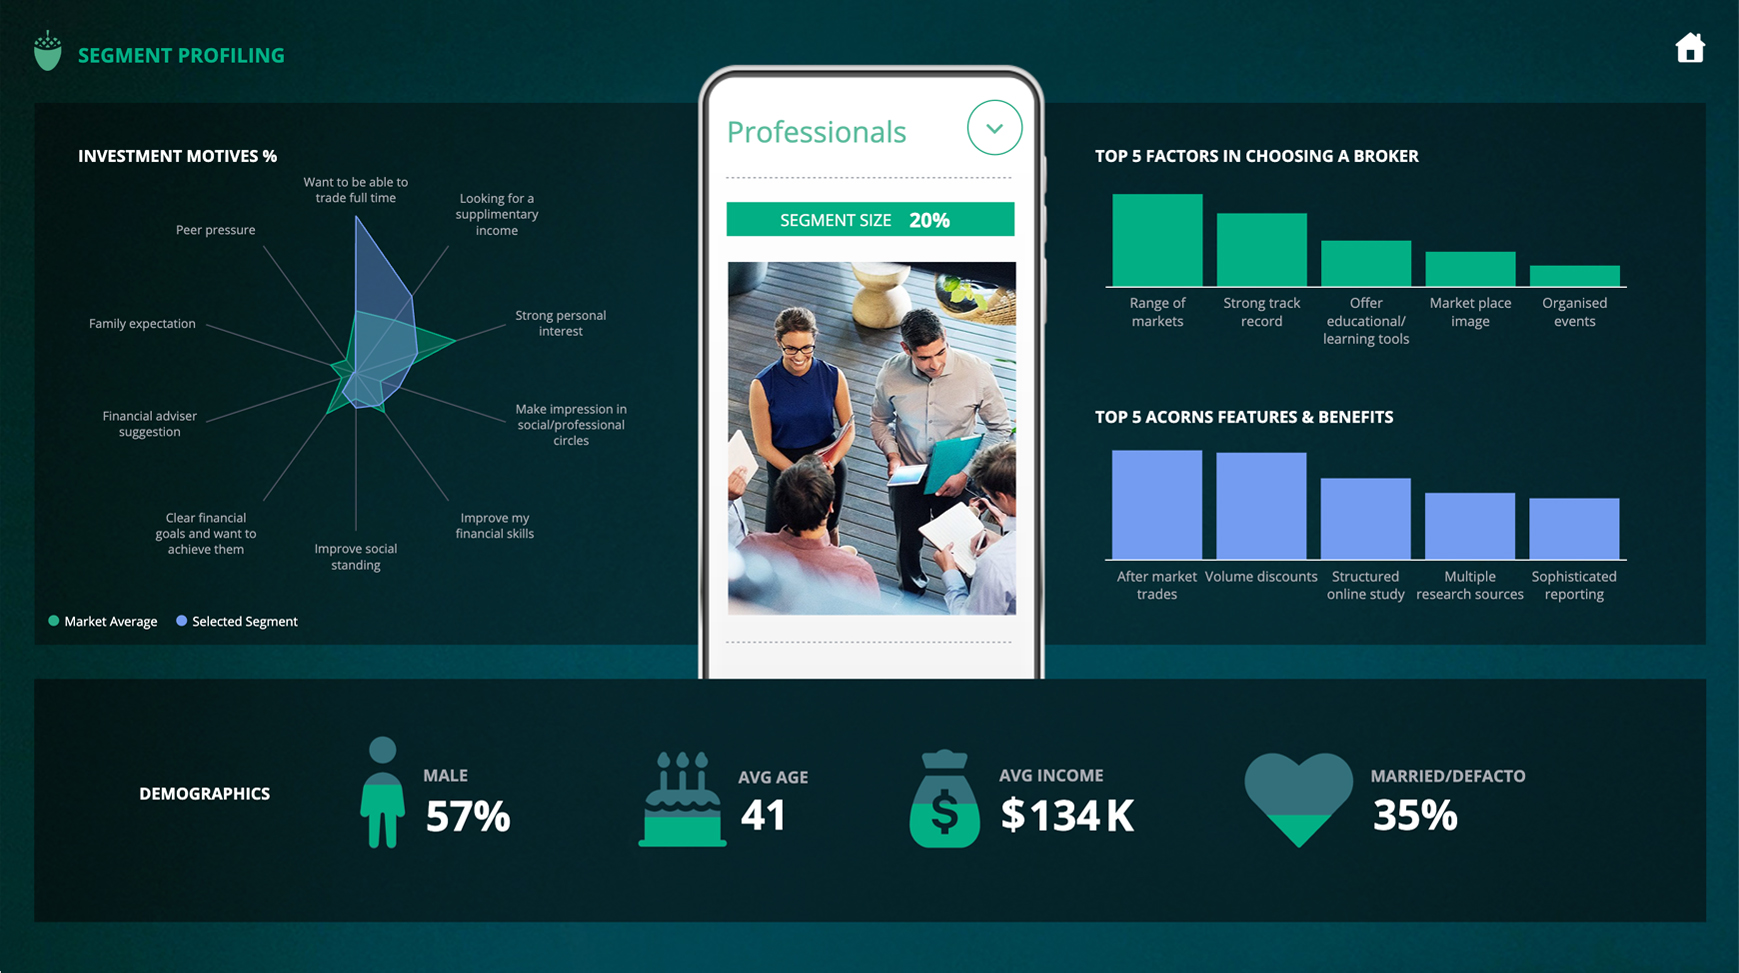
Online Broking Infographic Dashboard
Infographic
,
Interactive
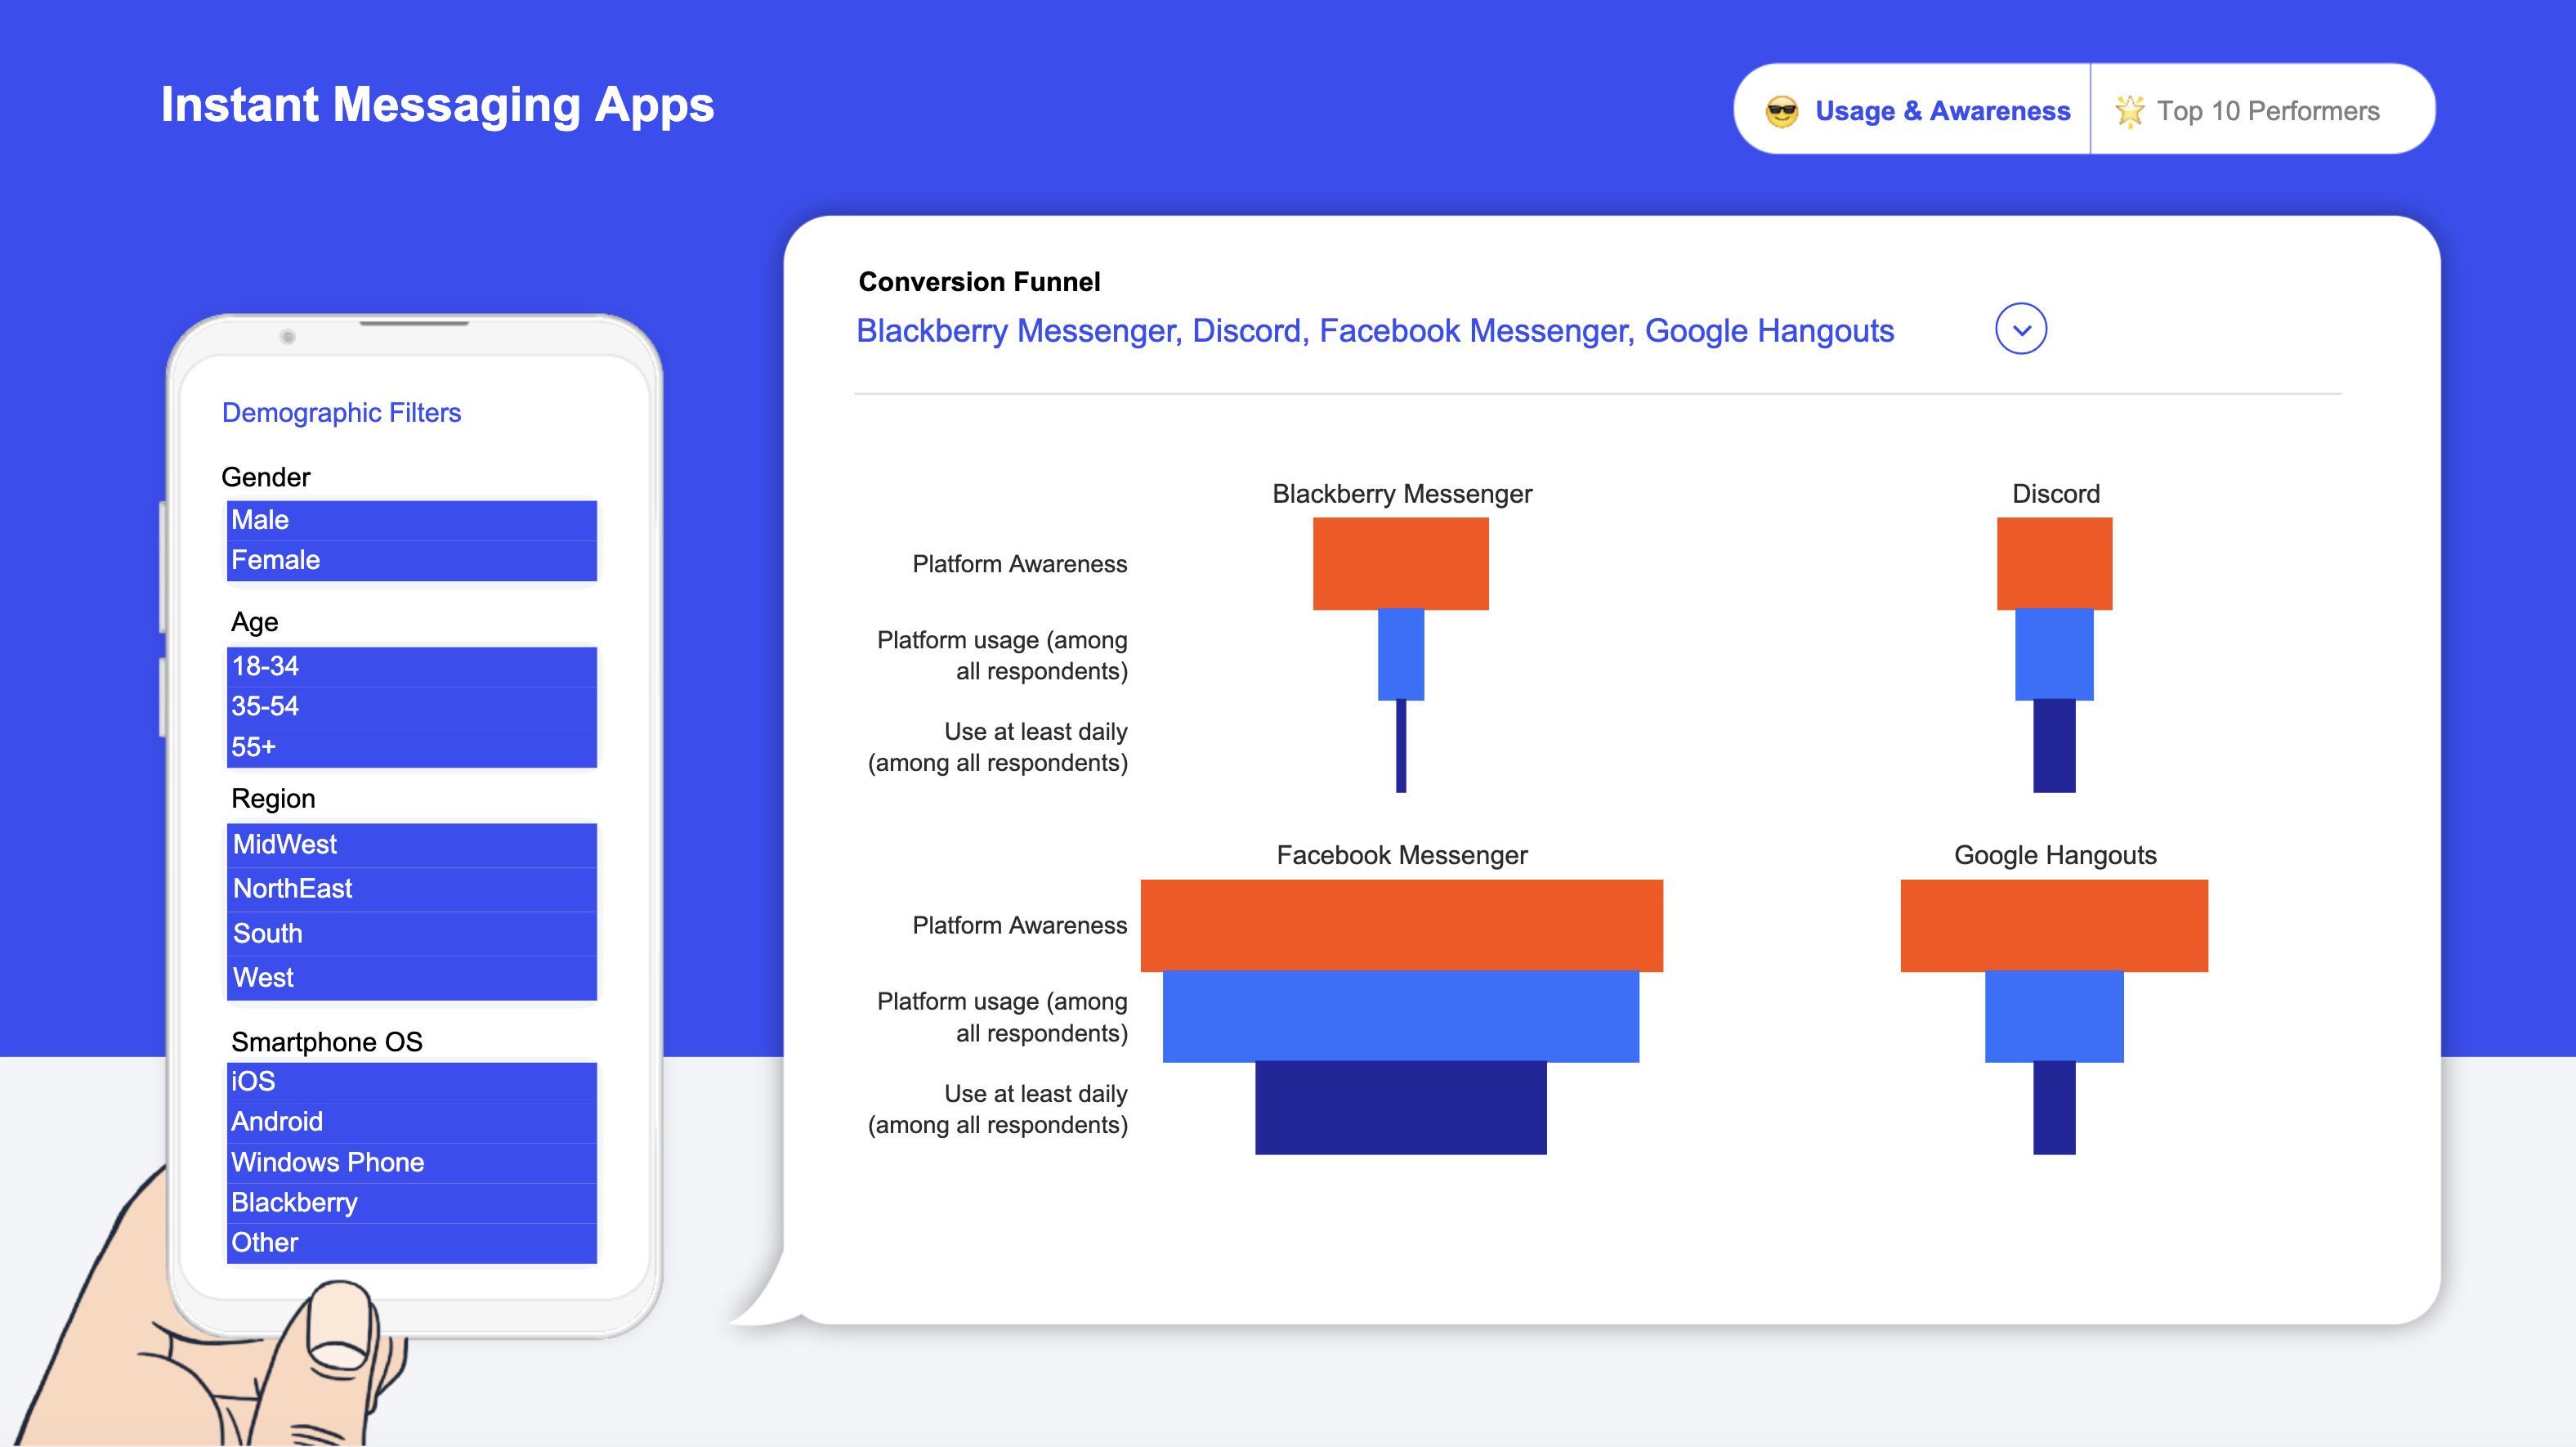
Instant Messaging Dashboard
Interactive
Customer Feedback Dashboard
Interactive
,
Multi-Page
New Product Development
Infographic
,
Interactive
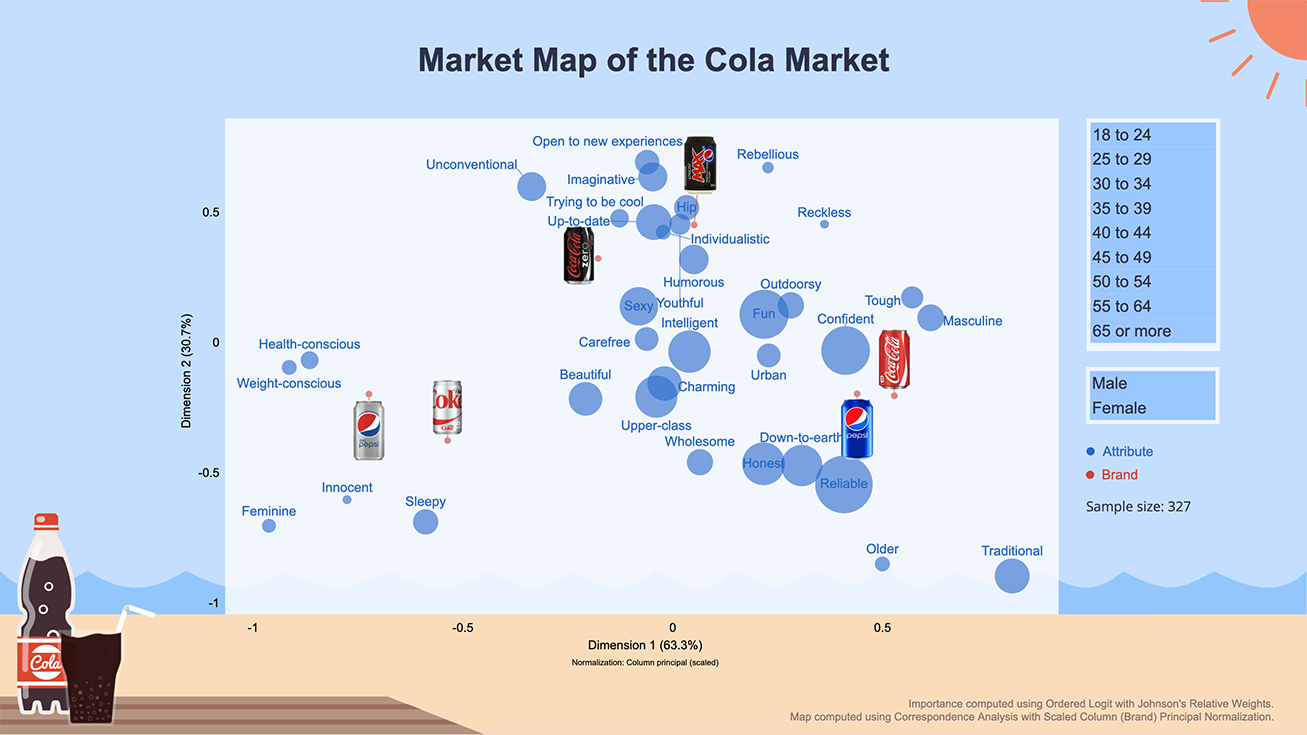
Filterable Market Map
Interactive
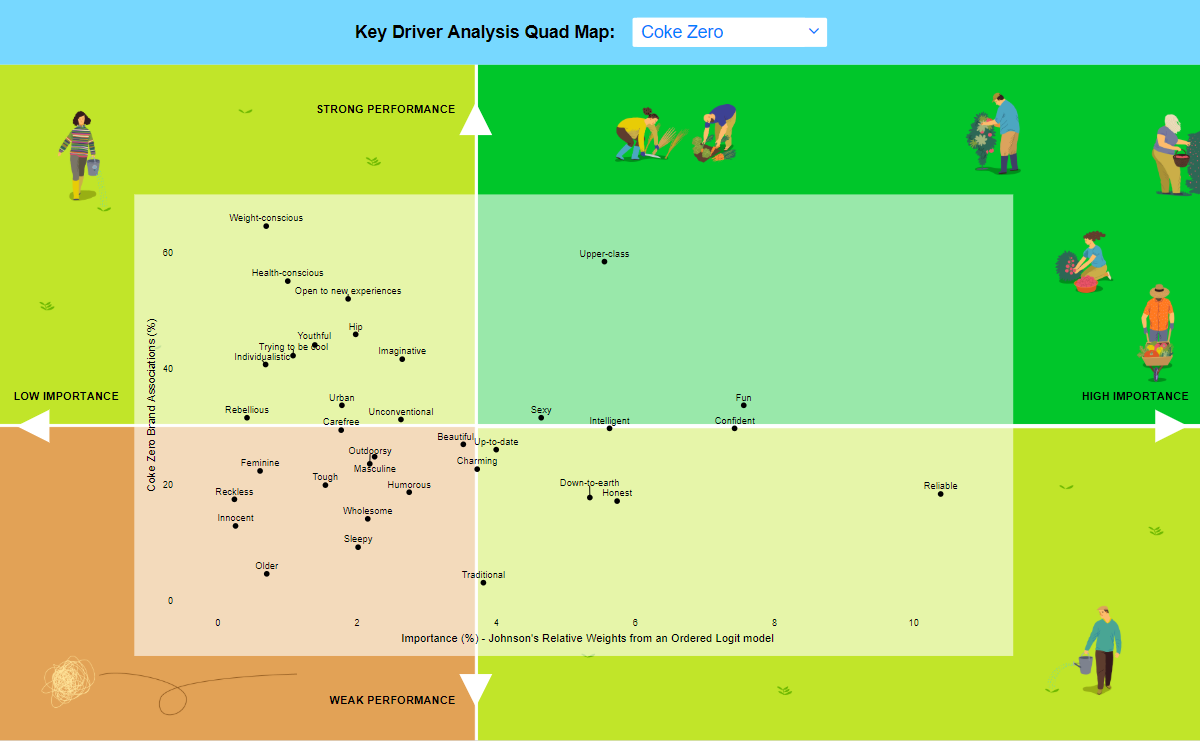
Key Driver Analysis Quad Map
Interactive
Decision Support Dashboard
Interactive
,
Multi-Page
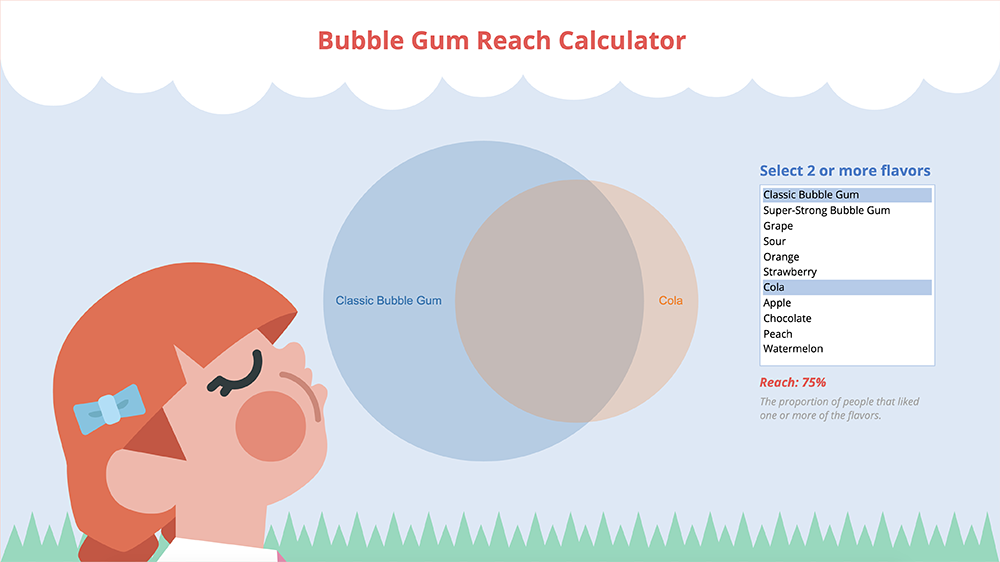
Bubble Gum Reach Calculator
Interactive
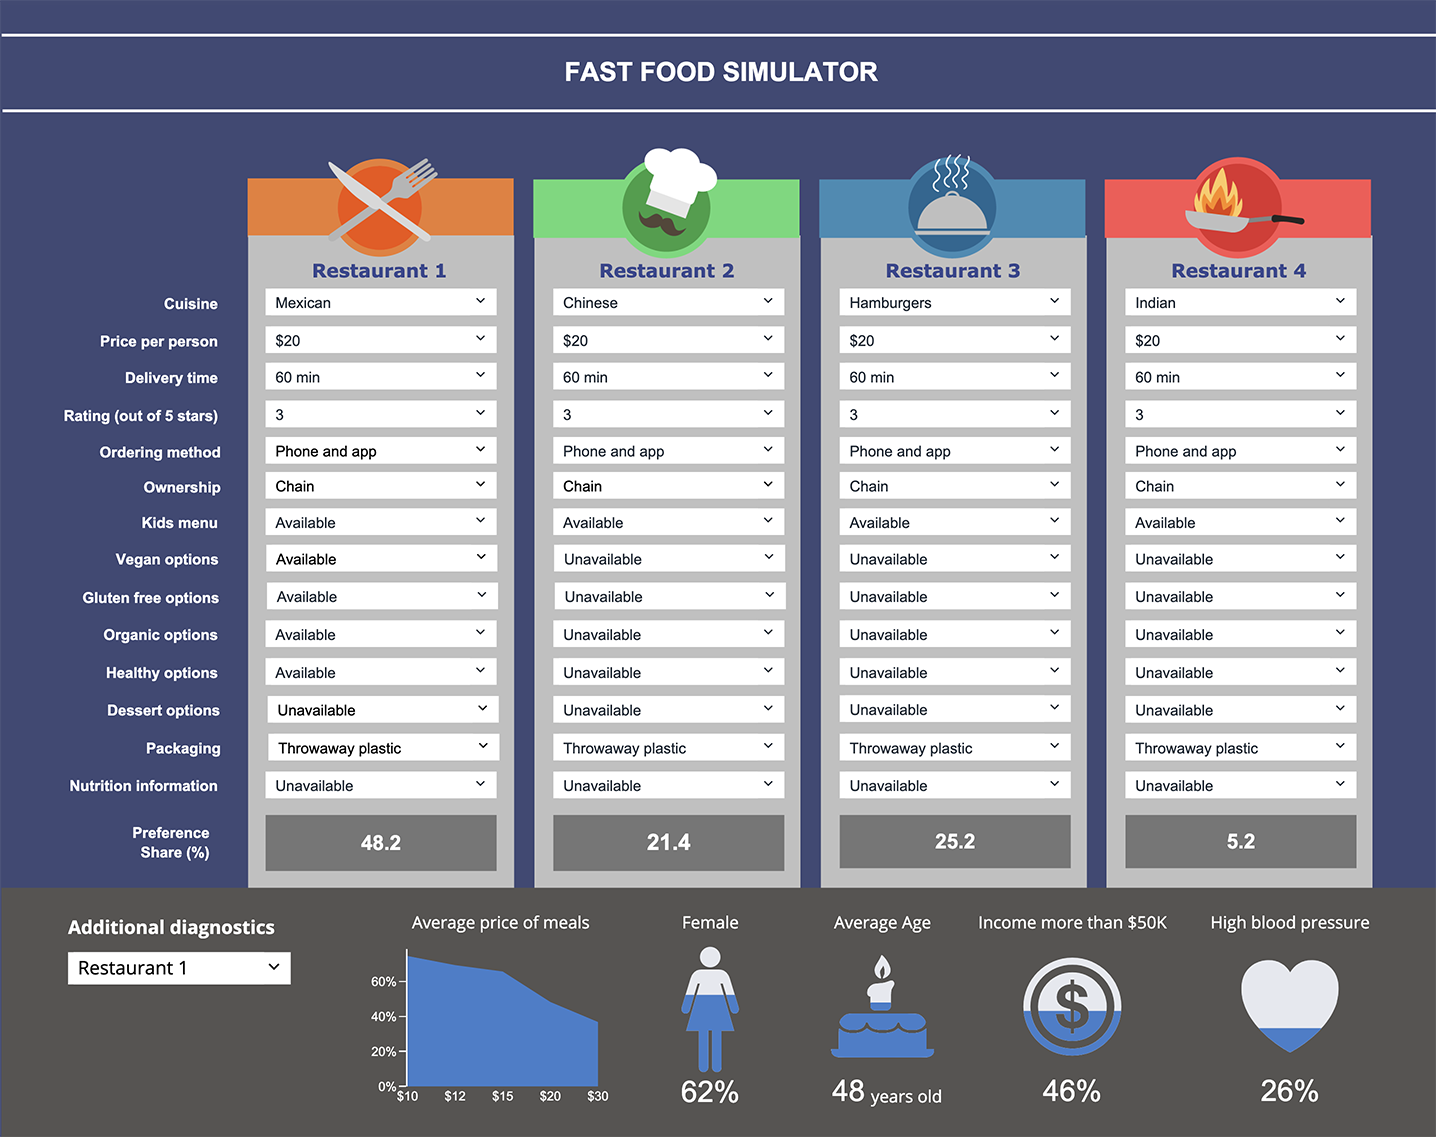
Fast Food Simulator
Interactive
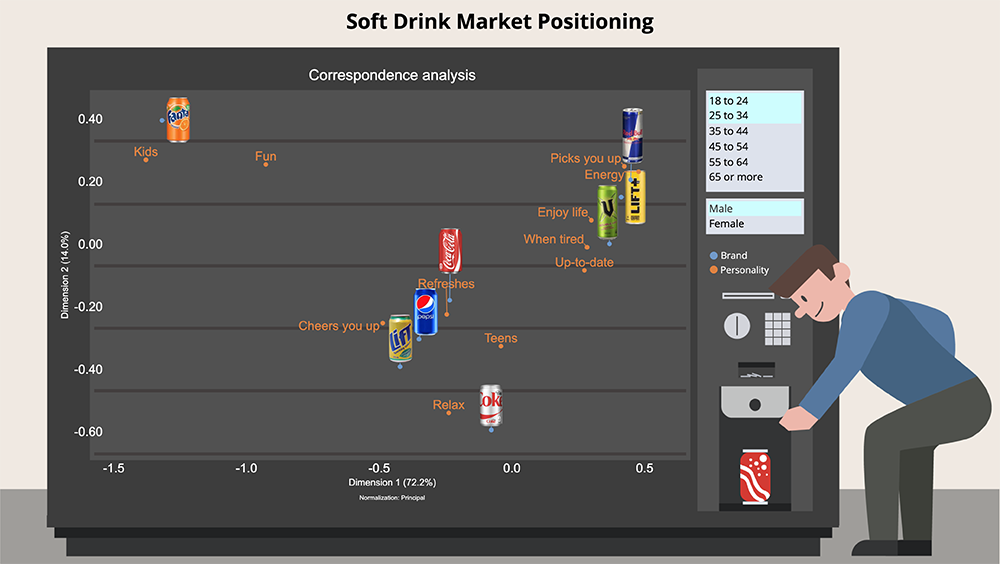
Soft Drink Marketing Positioning
Interactive
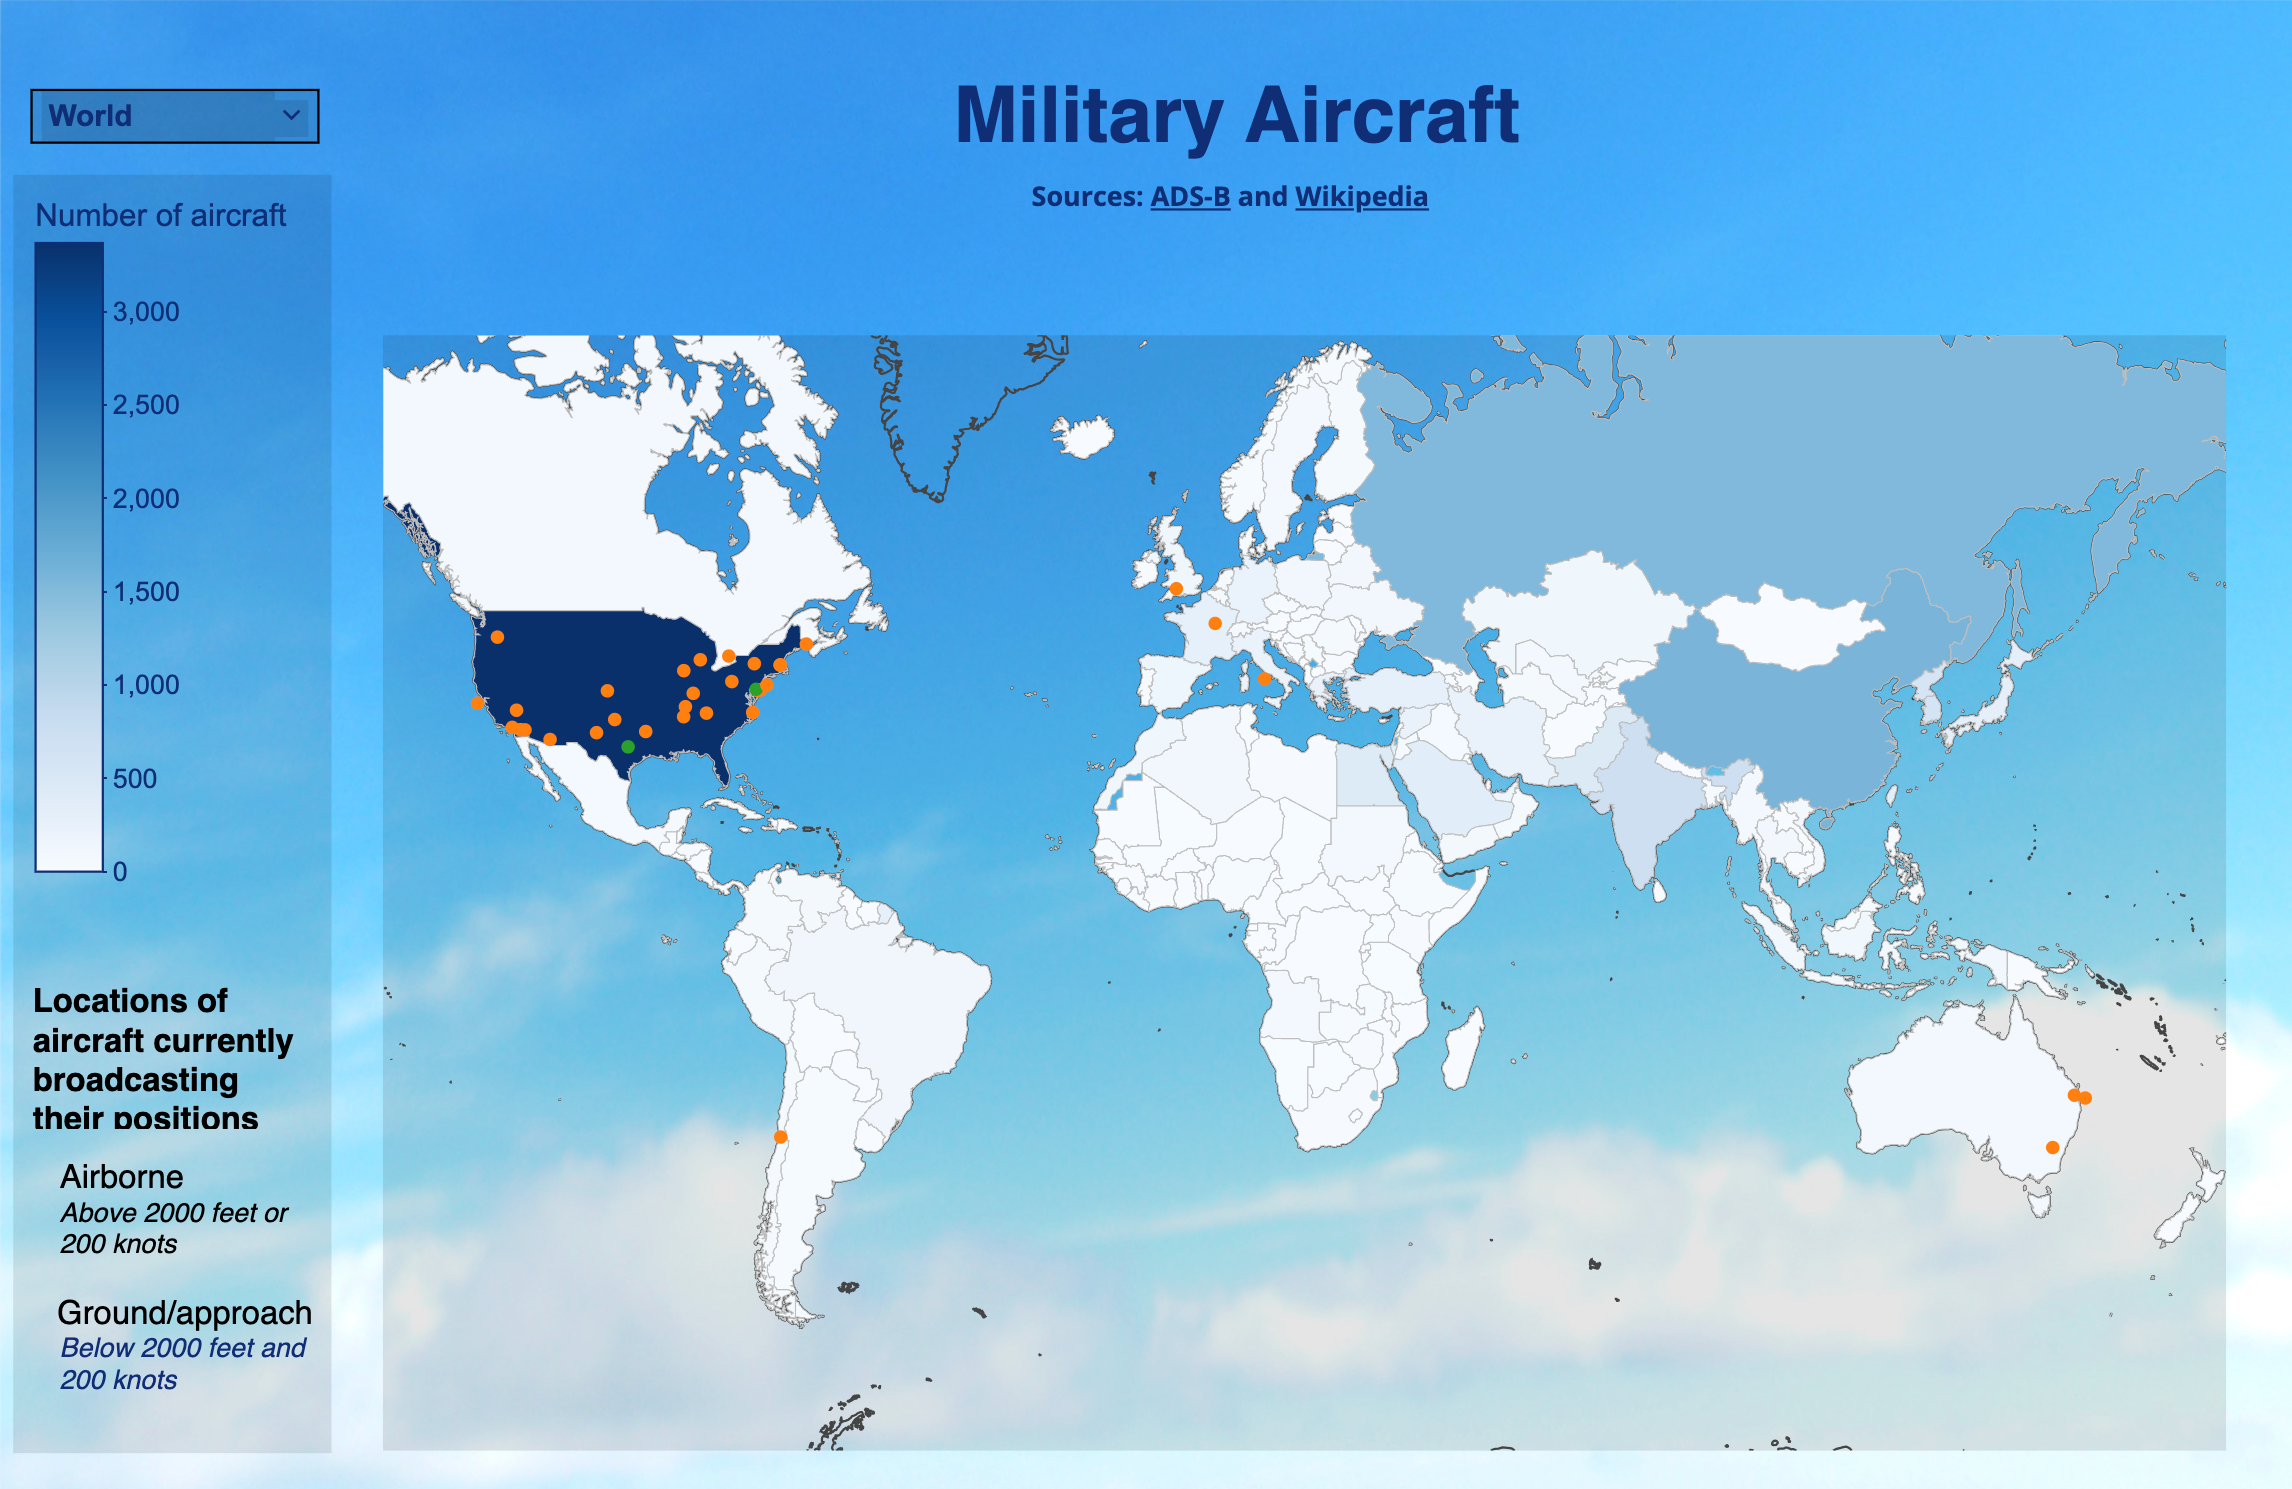
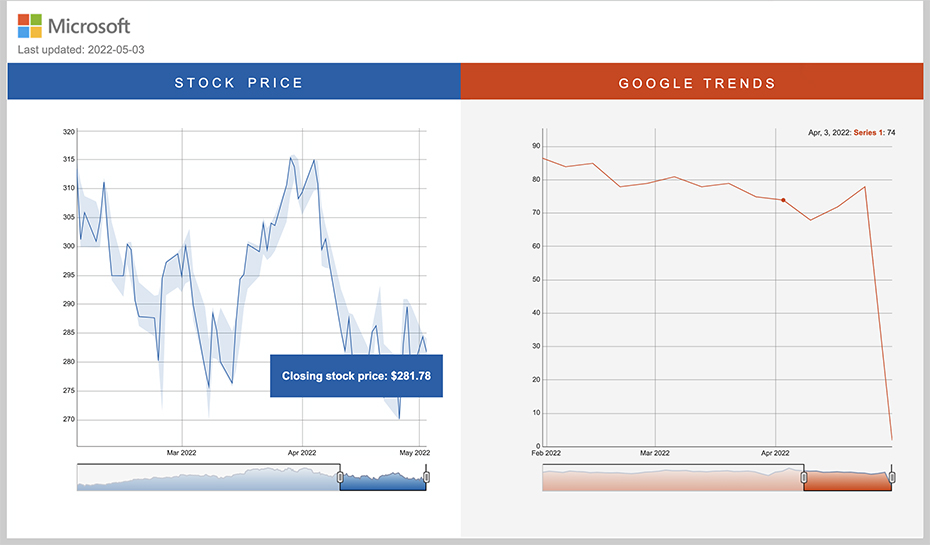
Geographic Dashboard with Real-Time Data
Interactive
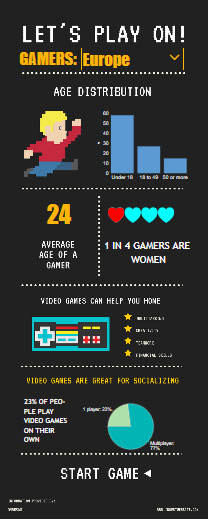
Interactive Infographic
Infographic
,
Interactive
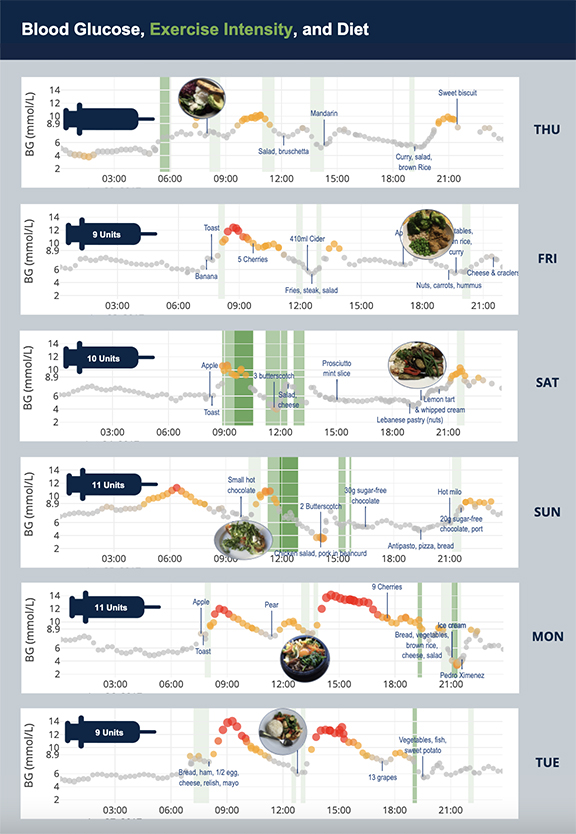
Blood Glucose Confections
Interactive
,
Tracking
What does America want in a Commander-in-Chief?
Interactive
,
Multi-Page
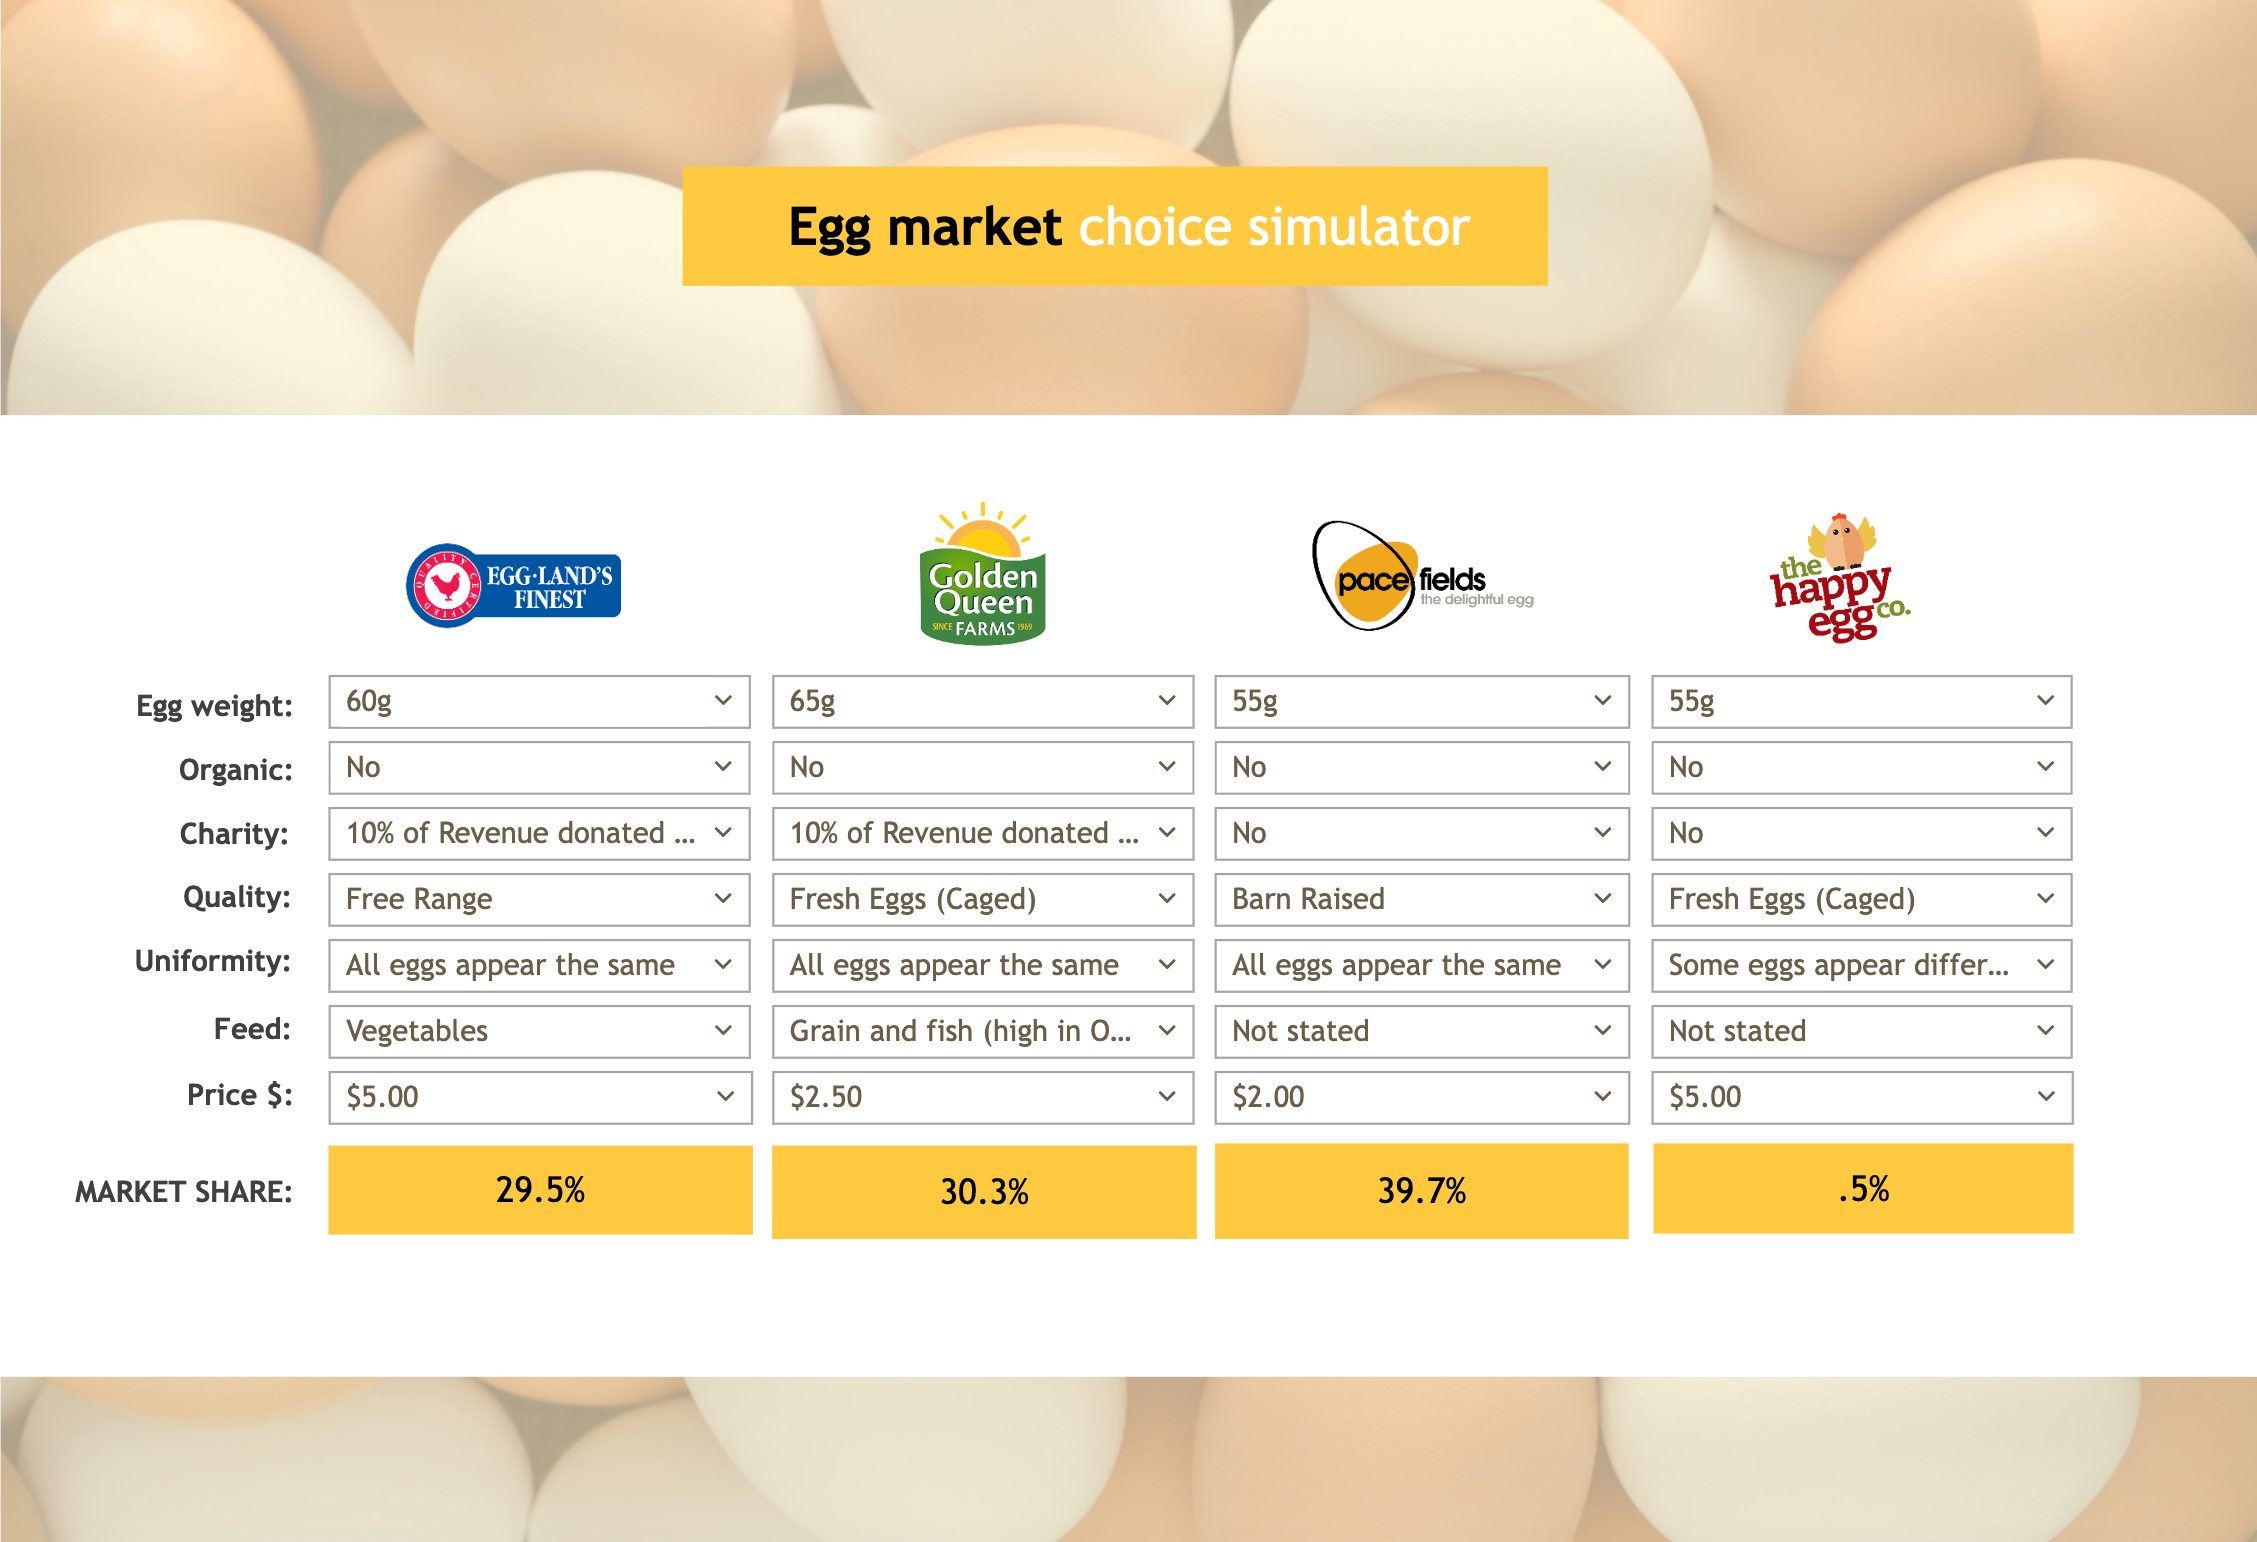
Choice Simulator
Interactive
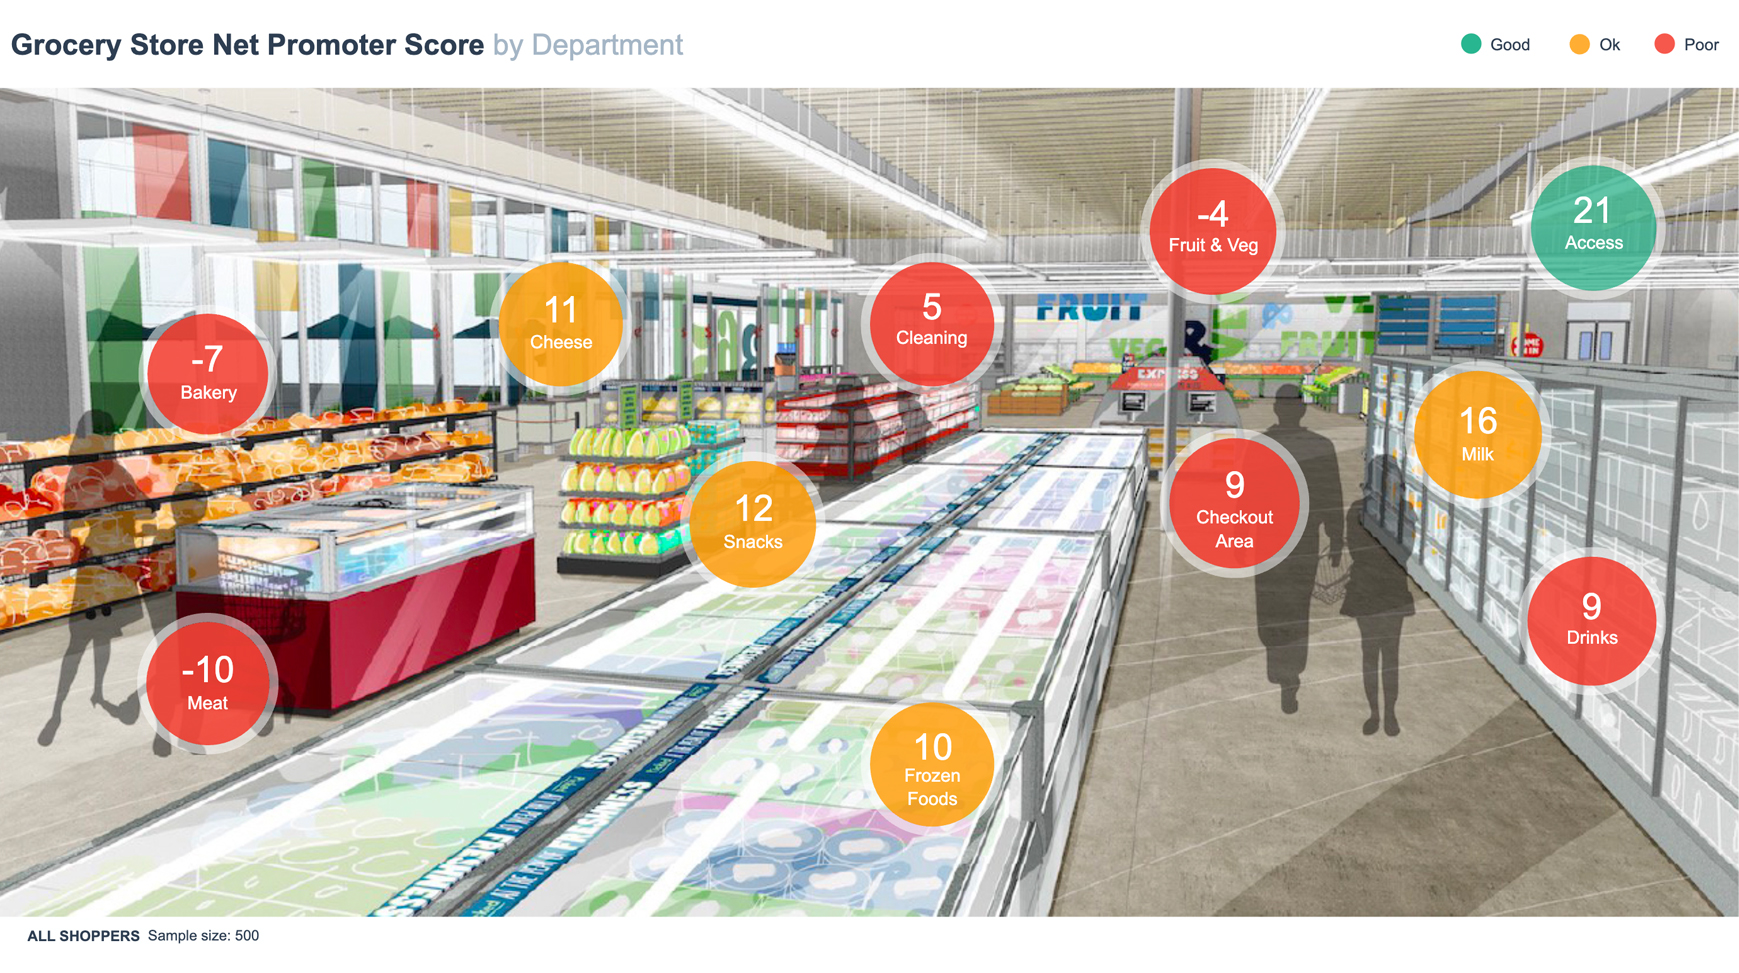
Grocery Store NPS Dashboard
Interactive
,
Multi-Page
A Simple Dashboard
Interactive
Dashboard with Hyperlinked Menu
Interactive
,
Multi-Page
KPI Dashboard
Interactive
,
Tracking
Register now