





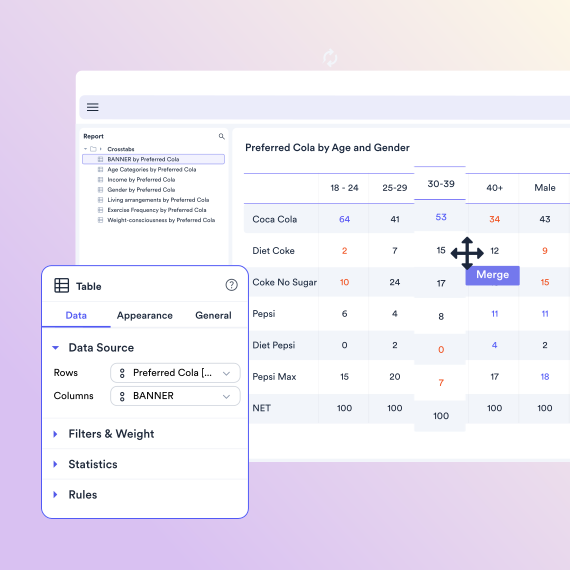


Survey analysis software turns raw responses into findings: crosstabs, significance testing, weighting, and reporting in one place. The best software for survey data analysis automates the mechanical steps; tests run on every table, weights apply themselves, reports update when new data arrives. So your time goes into interpreting results rather than producing them.
Displayr is built to analyze survey data end to end – import from any platform, clean and weight it, run the analysis, and publish the results, without moving between tools. This research tool covers collection and analysis as one connected workflow – collect in Qualtrics, SurveyMonkey, or Forsta, and the data flows in with structure intact.
“Out of the box” Displayr will perform appropriate statistical tests, highlighting the key results, as well as using sensible defaults for much more advanced things if you need to do them. Think of it as software for survey analysis, built for market researchers.
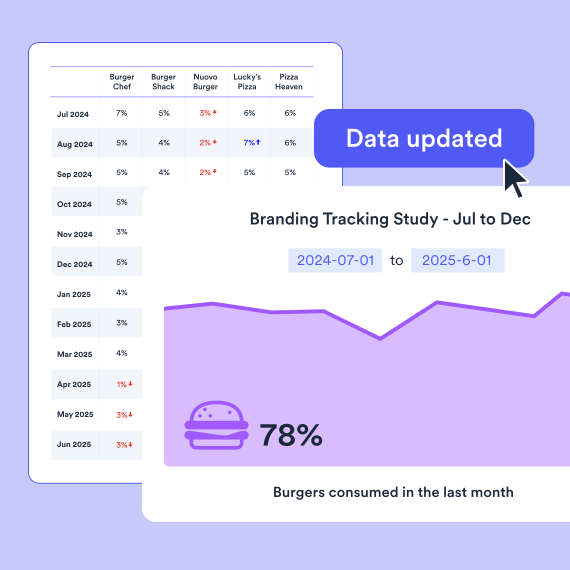
One of the real “aha” moments our users experience is when they discover they need to update all their analysis and reporting due to a data revision (e.g., some extra interviewing is completed). Unlike other survey data analysis tools, Displayr entirely automates this.
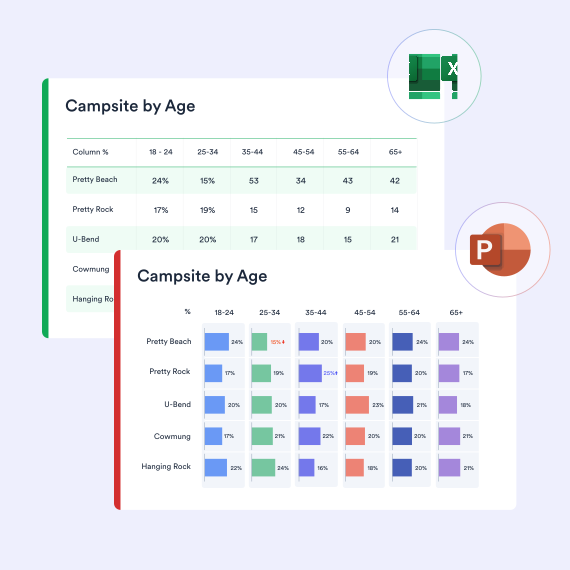
Any analyses you do can be automatically exported into Excel and PowerPoint. And, you can use Displayr to automatically update PowerPoint reports as well.
You can do the entire analysis reporting cycle, from cleaning data, creating tables, stat testing, writing reports, building dashboards and exporting to PowerPoint, without writing a single line of code.
Are you doing your work in a statistics program (e.g., R or SPSS) or a spreadsheet? Displayr’s designed by market researchers for market researchers. You’ll find yourself getting your work done 10 times as fast without all the errors if you use Displayr.
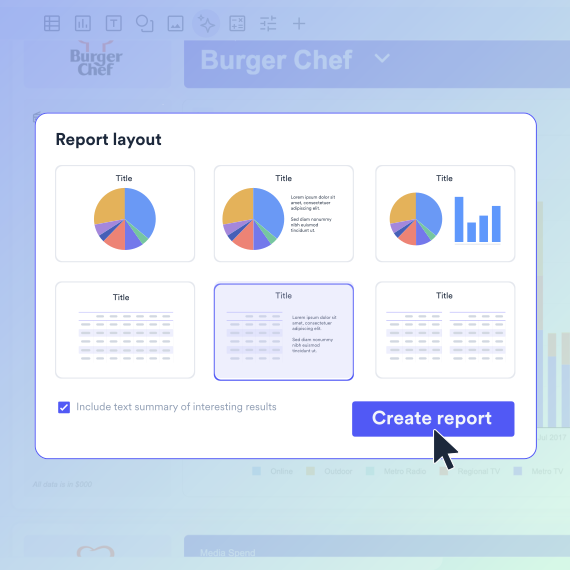
Displayr’s Research Agent lets you analyze survey data like never before. This smart AI agent transforms raw survey responses into rich reports—complete with data analysis, charts and strategic recommendations—in minutes. As an AI market research solution, it doesn’t just speed up your workflow—it automatically runs crosstabs, top-2-boxes, and highlights key insights – leaving you with more time to focus immediately on strategic decisions.

Founder, MAC Research

SQL, databases, Excel, CSV, text, SPSS, survey platforms, APIs, integrations, & more.

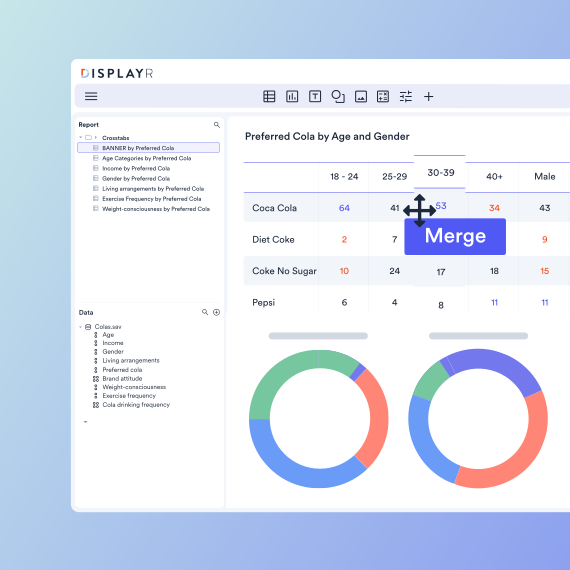
Summary tables, crosstabs, pivot tables, regression, text analysis, segmentation, machine learning, & more.
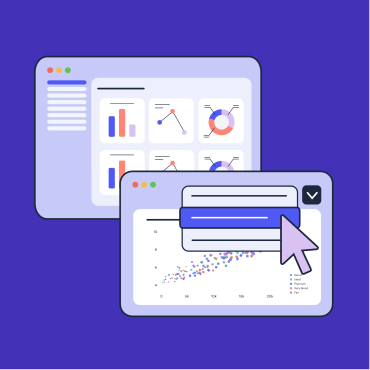
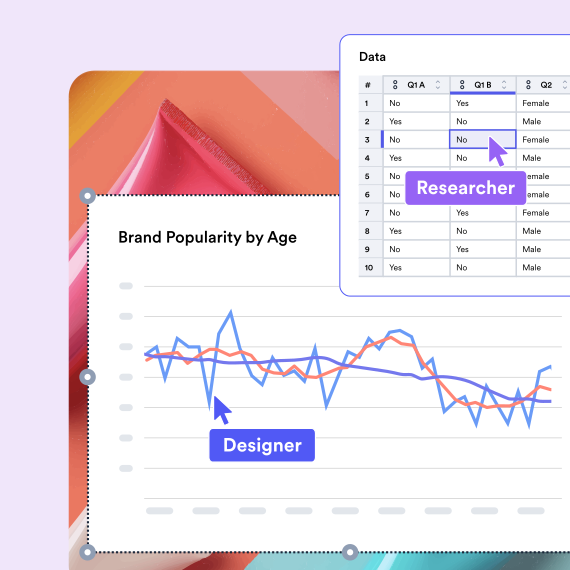
Data visualization, interactive data apps, dashboards, presentations, PowerPoint, Excel, PDF, web pages, & more.

Displayr’s Research Agents integrate AI across your full workflow, from data cleaning to analysis to reporting.
Displayr helps MAC Research cut reporting and analysis time by 2/3rds
Survey data analysis spans everything from preparing raw data to coding open-ends and sharing results. Here’s where to go deeper on each:
Survey analysis is all about interpreting survey data to find actionable insights and the story in the data. This usually involves lots of ‘grunt work’. Survey analysis can be broken down into eight different stages. Those are:
Displayr provides automation tools at each of these different stages, allowing users to dramatically cut down the time they spend analyzing surveys.
The key to analyzing survey data effectively lies in the final stage of analysis – finding the story. To easily find the best story in your survey data, remember to:
There are many different survey analysis tools available today. Selecting the best tool is individual and depends on your specific skillset, as well as the data you are working with. Some of the top tools for survey data analysis include:
Yes. Provided you have the required technical skills, R is a powerful tool for survey analysis, offering a variety of packages for data manipulation and statistical analysis. You can use R to:
Advances in AI and Natural Language Processing have drastically improved the analysis of open-ended survey responses. These open-ended responses can be analyzed using:
Increasingly, yes – AI in Displayr codes open-ended responses, drafts summaries, and updates analysis when new data arrives. The critical requirement is traceability: every AI-generated number should link back to the data and method behind it, so you can defend it to a client or stakeholder. That’s what separates survey analysis software with built-in AI from pasting data into a chatbot.