
How To Build an Interactive Globe in R With The Three.js Package
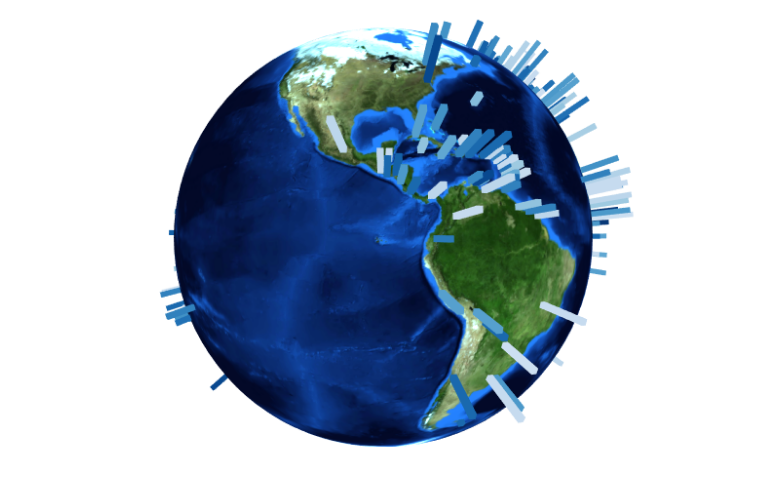
This post describes how to use the threejs package to plot data on a globe, allowing rotation and zoom. Location markers are added as lines, allowing geographic data to be visualized. In this earlier post we analysed the location of meteorite impacts, including plotting their fall locations on a globe. Forming part of the analysis […]
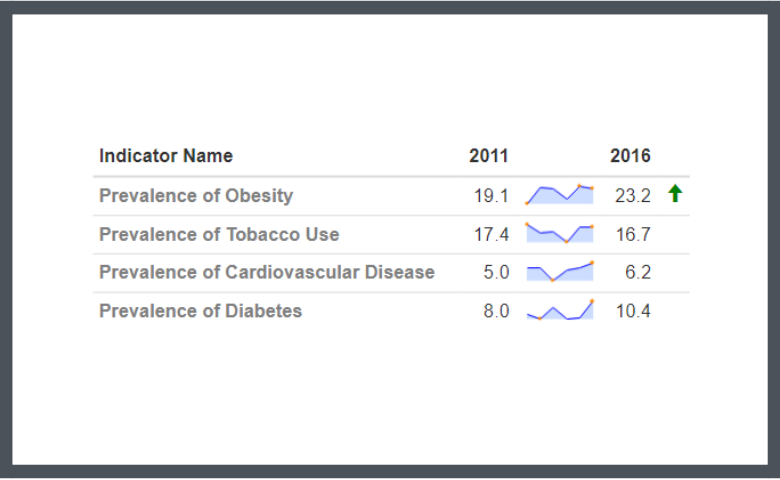
Creating Tables Using R and Pure HTML

A problem with R is that its tables are not good enough to share with non-R users, both in terms of visual attractiveness and ease of reading – particularly when the table is large. Quite a few different packages, tools, and workflows have been developed to address this problem, from formattable through to R Markdown […]
Make Beautiful Tables with the Formattable Package
I love the formattable package, but I always struggle to remember its syntax. A quick Google search reveals that I’m not alone in this struggle. This post is intended as a reminder for myself of how the package works – and hopefully you’ll find it useful too! Default formattable example The table below is an […]
5 Alternatives to the Default R Outputs for GLMs and Linear Models
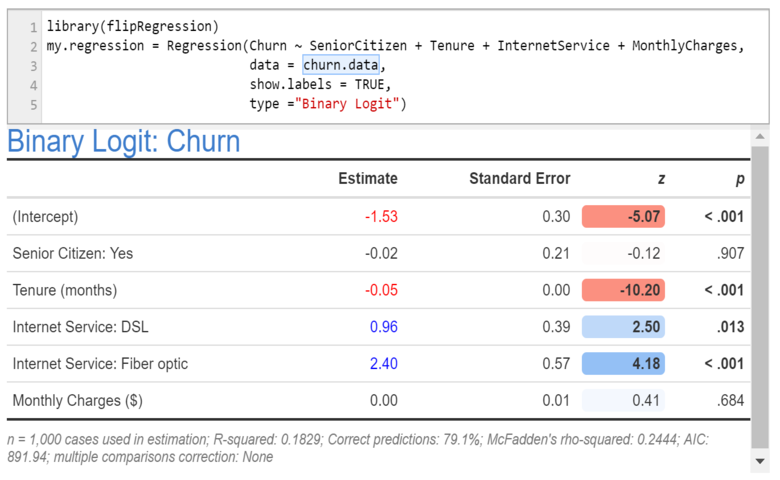
The standard summary outputs from the glm and lm summary methods are a case in point. If you have been using R for as long as I have (19 or 20 years…) you will no doubt have a certain affection for them, but to a new user they are both ugly and not optimized to […]
Using R to Create Free Online Dashboards
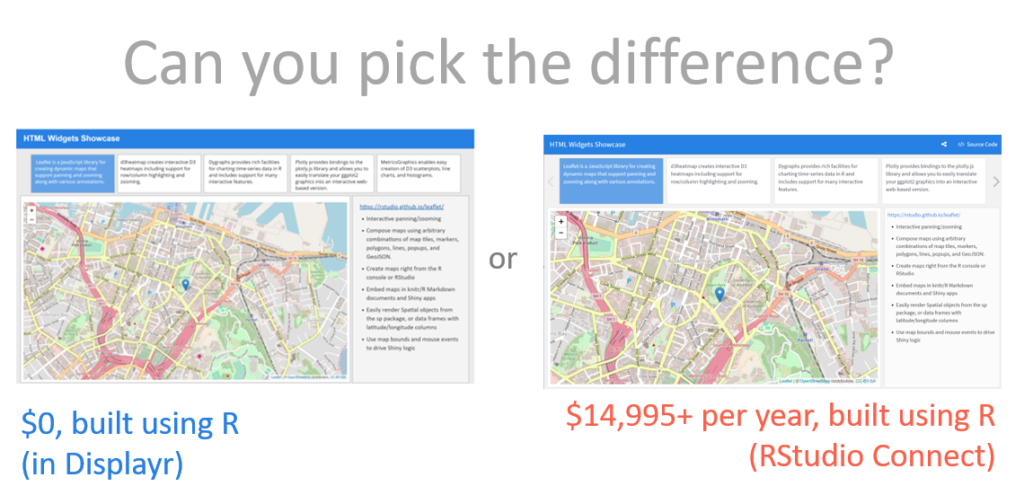
It is now possible to create public dashboards, based on R code, for free! To illustrate how it works, I’ve used the free version of Displayr to create a copy of RStudio Connect’s HTML Widgets Showcase. Getting started The first step is to click this link which will prompt you to sign up. Sign up is free. Then all you […]
