






The Power BI Alternative for Survey Data

Power BI is a powerful business intelligence platform that integrates seamlessly with Microsoft’s ecosystem. But most people searching for a PowerBI alternative for survey data have hit the same wall: preparing survey data for analysis is difficult and time-consuming, and the advanced techniques researchers rely on aren’t built in. Displayr is the Power BI equivalent purpose-built for survey data – a competitor on dashboards and reporting, with end-to-end research workflows that Power BI can’t match: native survey data structures, statistical testing, and a complete suite of analysis tools designed specifically for researchers.

Illustration of Happy Client using Displayr
Illustration of Power BI vs Displayr
Trusted by 2,900+ research teams worldwide

Built to handle survey data effortlessly and give researchers everything they need in one place

Displayr is a purpose-built survey analysis and reporting platform designed to streamline every step of your workflow. From data cleaning and advanced analytics to automated PowerPoint reporting, Displayr does the heavy lifting so your team can focus on delivering insights faster, with less effort, and no coding required.

Single Document Collaboration
Collaborate in real time on a single online document - analyze data, build visualizations, and write reports together without back-and-forth files.
Prompt-Based Analysis
Use custom prompts to analyze data, summarize outputs etc.
Agentic AI Capabilities
Dedicated AI Research Agent that works directly with your data.
AI Data Preparation Agent
Automatically reviews or helps prepare datasets with AI, suggesting or applying transformations based on natural language input (e.g., cleaning, recoding, splitting, flagging issues).
Automated Statistical Testing
Automatically select and run the right tests (e.g. t-tests, ANOVA, regression), then update them with filters or new data.
Full Suite of Built-In Analysis Techniques
Conjoint, MaxDiff, regression, segmentation, factor analysis, TURF, etc.
AI-Powered Text Analytics
AI categorizes open-ends, calculates sentiment, performs entity extraction and more.
Interactive Dashboarding
Create dynamic, interactive dashboards and visual outputs that connect and change with your source data.
AI Code Assistant
AI-generated code and ability to customize (e.g., R or Python).
Automated Reporting
Reusable templates, auto-updating reports and dashboards.
Custom Onboarding & Live Support
How fast new users can get productive (with or without training).
SOC2 Compliance & Security Controls
Regional hosting, user access controls, compliance (SOC2, GDPR, etc.)
Data Connectivity & Large-Scale Importing
Connect directly to Qualtrics, SurveyMonkey, Decipher, etc. via API, or upload large files from cloud storage. Designed to work with complex and high-volume survey data.
Displayr
  • Single Document Collaboration
    Collaborate in real time on a single online document - analyze data, build visualizations, and write reports together without back-and-forth files.
  • Prompt-Based Analysis
    Use custom prompts to analyze data, summarize outputs etc.
  • Agentic AI Capabilities
    Dedicated AI Research Agent that works directly with your data.
  • AI Data Preparation Agent
    Automatically reviews or helps prepare datasets with AI, suggesting or applying transformations based on natural language input (e.g., cleaning, recoding, splitting, flagging issues).
  • Automated Statistical Testing
    Automatically select and run the right tests (e.g. t-tests, ANOVA, regression), then update them with filters or new data.
  • Full Suite of Built-In Analysis Techniques
    Conjoint, MaxDiff, regression, segmentation, factor analysis, TURF, etc.
  • AI-Powered Text Analytics
    AI categorizes open-ends, calculates sentiment, performs entity extraction and more.
  • Interactive Dashboarding
    Create dynamic, interactive dashboards and visual outputs that connect and change with your source data.
  • AI Code Assistant
    AI-generated code and ability to customize (e.g., R or Python).
  • Automated Reporting
    Reusable templates, auto-updating reports and dashboards.
  • Custom Onboarding & Live Support
    How fast new users can get productive (with or without training).
  • SOC2 Compliance & Security Controls
    Regional hosting, user access controls, compliance (SOC2, GDPR, etc.)
  • Data Connectivity & Large-Scale Importing
    Connect directly to Qualtrics, SurveyMonkey, Decipher, etc. via API, or upload large files from cloud storage. Designed to work with complex and high-volume survey data.
PowerBI Logo
  • Single Document Collaboration
    Collaborate in real time on a single online document - analyze data, build visualizations, and write reports together without back-and-forth files.
  • Prompt-Based Analysis
    Use custom prompts to analyze data, summarize outputs etc.
  • Agentic AI Capabilities
    Dedicated AI Research Agent that works directly with your data.
  • AI Data Preparation Agent
    Automatically reviews or helps prepare datasets with AI, suggesting or applying transformations based on natural language input (e.g., cleaning, recoding, splitting, flagging issues).
  • AI-Powered Text Analytics
    AI categorizes open-ends, calculates sentiment, performs entity extraction and more.
  • Interactive Dashboarding
    Create dynamic, interactive dashboards and visual outputs that connect and change with your source data.
  • Automated Reporting
    Reusable templates, auto-updating reports and dashboards.
  • Custom Onboarding & Live Support
    How fast new users can get productive (with or without training).
  • SOC2 Compliance & Security Controls
    Regional hosting, user access controls, compliance (SOC2, GDPR, etc.)
  • Data Connectivity & Large-Scale Importing
    Connect directly to Qualtrics, SurveyMonkey, Decipher, etc. via API, or upload large files from cloud storage. Designed to work with complex and high-volume survey data.
With Displayr, my survey data is ready to analyze the moment I open it - no time lost wrangling files like I used to with Power BI.
Displayr customer
Displayr customer

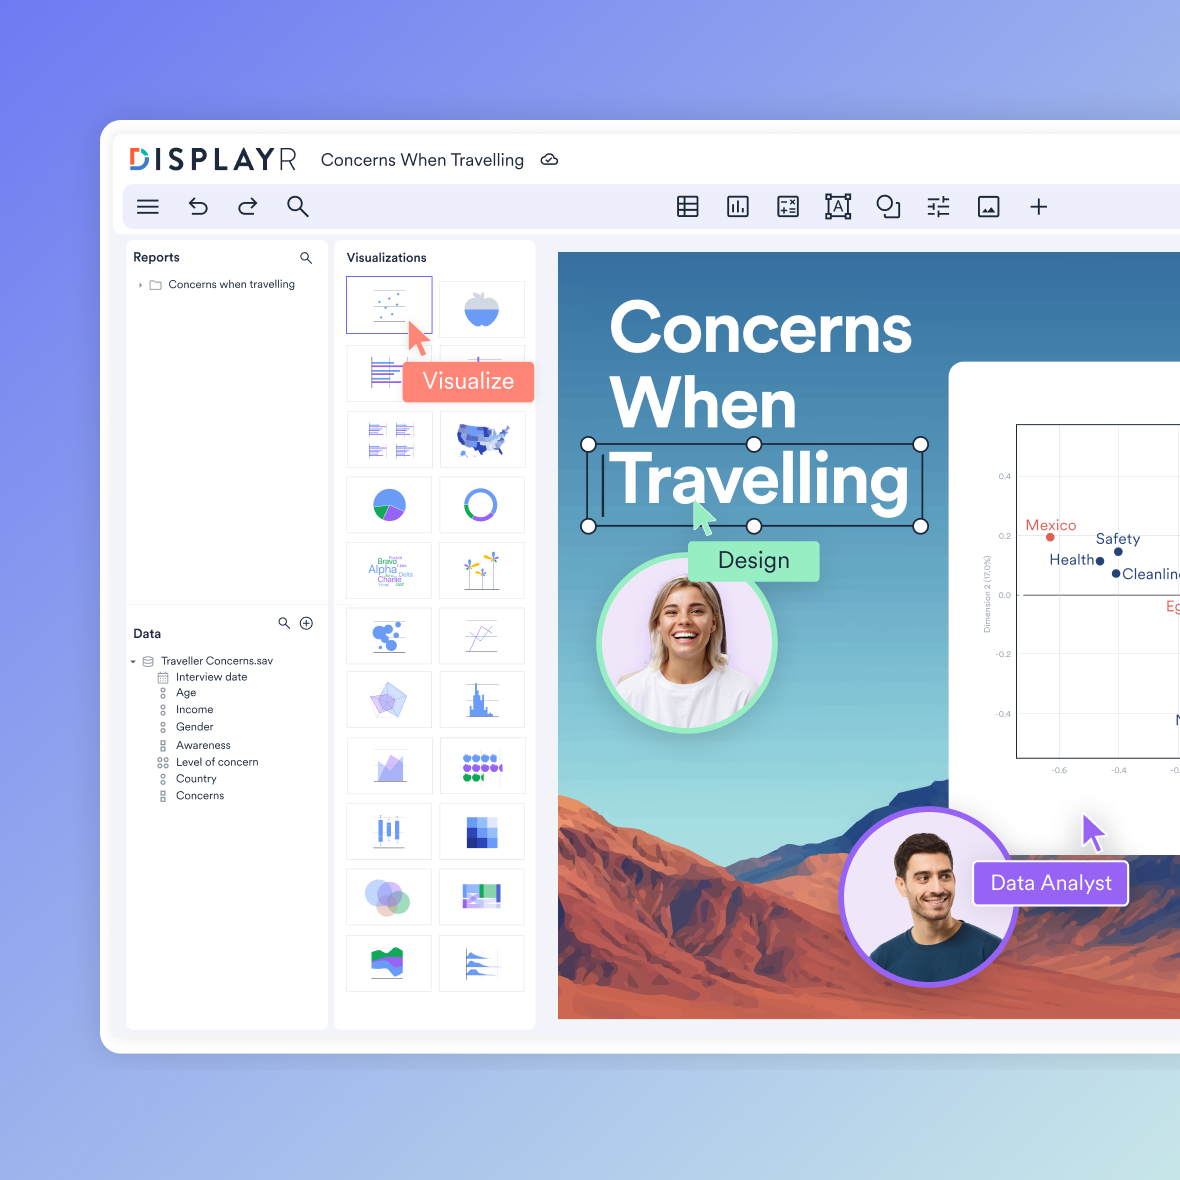
Displayr Visualisation

Work faster

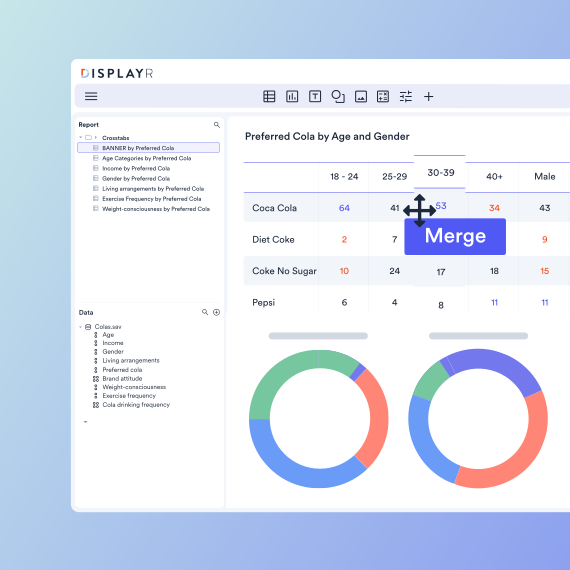
Displayr has everything you need for survey analysis built in, meaning you can turn hours of work into seconds. Whether you need automated stat testing, text and multivariate analysis, data cleaning, or automatic updating reports – Displayr helps you automate some of the most time-consuming survey analysis tasks. And with real-time collaboration, you can move faster as a team.

Advanced analyses, no DAX

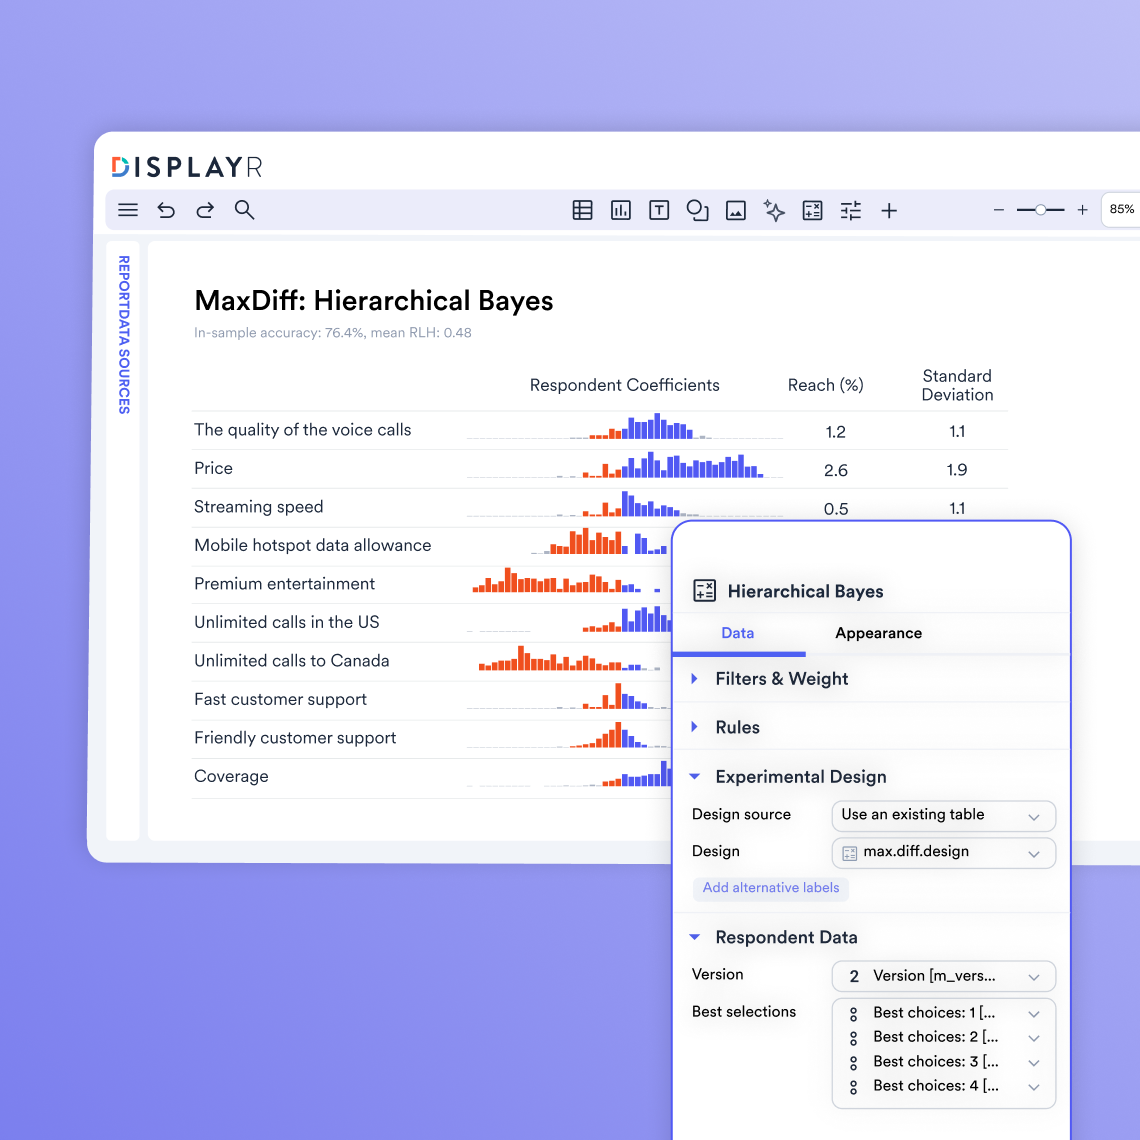
While it is possible to perform advanced analyses such as regression, conjoint, correspondence analysis, MaxDiff, and factor analysis in Power BI, you need to know DAX coding language to get anything meaningful done. With Displayr, you can run regression, conjoint, MaxDiff, and factor analysis without coding. Displayr helps you do it confidently and clearly work towards your research goals and provides peace of mind with simplicity and control.

Displayr Advanced Analyses No Dax
Survey analysis - No code

Peace of mind

No code, a low learning curve, and user-friendly design – Displayr is designed to take the stress out of survey analysis. With so many automated workflows, working in Displayr means fewer errors. But if you do find a mistake, you can easily trace it, fix it and auto-update everything – ensuring quality and peace of mind.

Displayr vs Power BI for 

survey data

The difference comes down to what each tool assumes about your data. Power BI assumes clean database tables – so multi-response questions, grids, weights, and waves have to be forced into shape before you can start. Displayr assumes survey data from the start: it supports all survey file formats, understands survey structures natively, and applies significance testing automatically. Create interactive, filterable dashboards using hundreds of dynamic visualizations that update instantly, share results, and impress clients with live, editable reporting. 

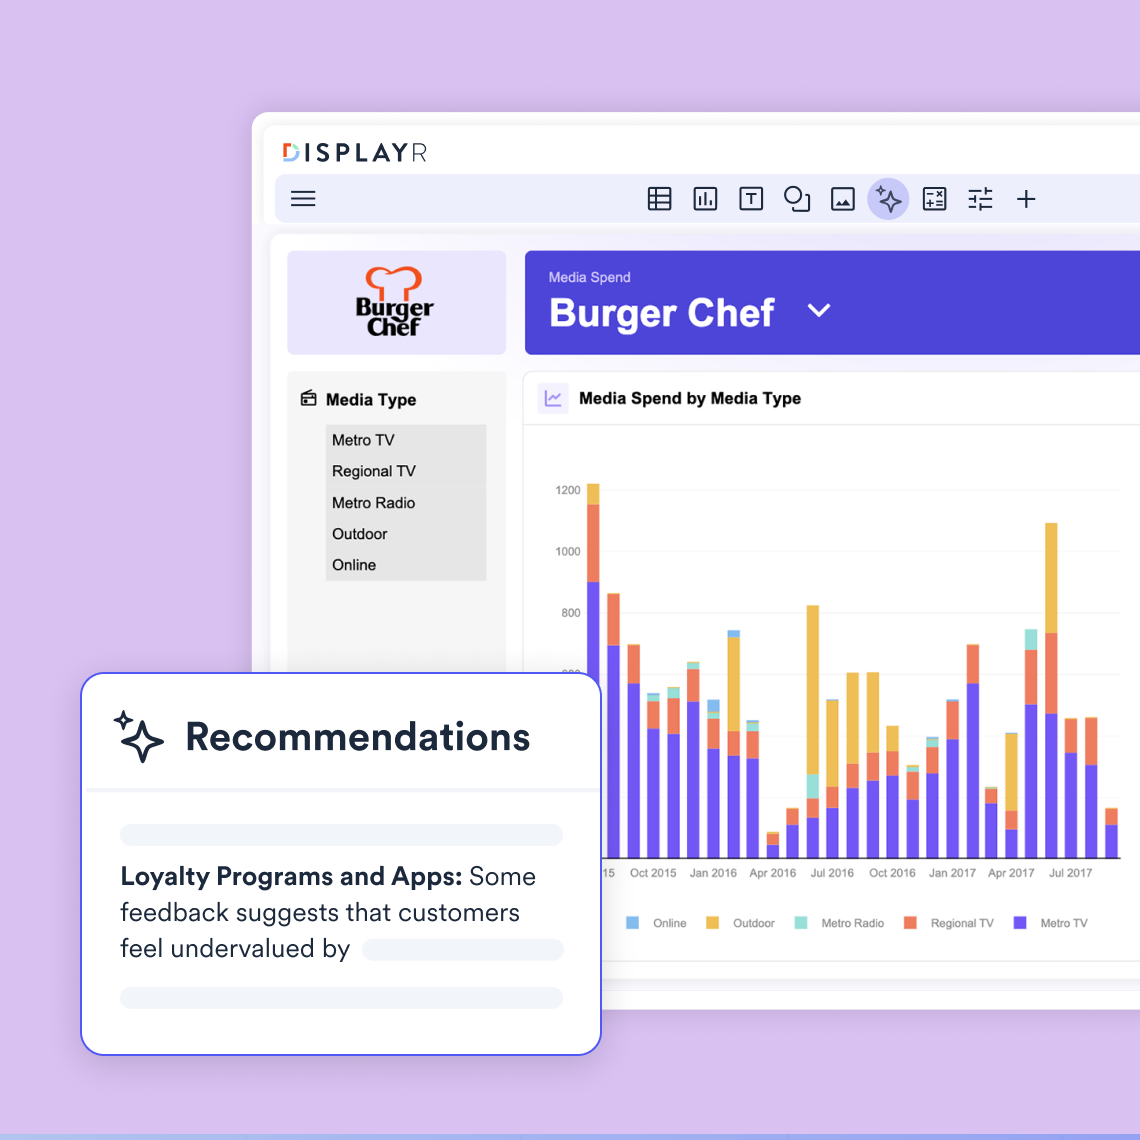
Displayr - BI for Survey Data

See why people love Displayr

Frequently Asked Questions

What is the best alternative to Power BI for survey data?

Displayr. It reads survey data structures natively (multi-response questions, grids, weights), runs statistical testing automatically, and exports auto-updating PowerPoint reports alongside live dashboards. Power BI can chart survey results, but researchers rebuild those foundations by hand.

Partially, but not with the rigour researhers need. Power BI can visualize survey results once the data is flattened, but it has no native concept of multi-response questions, weighting, or significance testing — analysts typically recreate these in DAX by hand. Tools built for survey data handle them out of the box, without coding.

Your Displayr deep dive starts here

Chat with us