


When computing a statistic using a sample, it is often possible to compute the likely extent of sampling error. This makes it possible to make conclusions about the extent to which statistics computed from a sample will reflect the truth about the world.
The amount of sampling error is determined by four things. These are the sample size, the sampling method, the inherent variability in the population, and the population size.
Worked example
Stack Overflow, a popular online question-and-answer forum for software developers, recently conducted a survey that found that about 10% of people on their site were female. How much sampling error is attached to such an estimate? To understand the extent of sampling error, we will start by investigating the amount of sampling error we might expect if:
- We assume that it is true that 10% of people who use Stack Overflow are women.
- We have a sample of ten people.
If we randomly select ten people and 10% of people are female, this means that each of the people we choose will have a 10% chance of being female (this is a heroic assumption, due to factors discussed later in this article and also to non-sampling error, but it greatly simplifies the explanation of sampling error).
So, the chance of ten out of ten people in our sample being female is 0.1*0.1*0.1*0.1*0.1*0.1*0.1*0.1*0.1*0.1 = 0.00000001%. That is, there is essentially no chance that if in truth 10% of Stack Overflow users were women, that we would observe this as being 100% in a survey of 10 people.
By contrast, the probability of there being no women in our sample is 0.9*0.9*0.9*0.9*0.9*0.9*0.9*0.9*0.9*0.9 = 34.9%, where 0.9 is the probability that a man is selected at random, where this is 1 minus the probability of being a woman.
With a bit more math we can compute the chart below, which shows the probability that in our sample of ten people we would get 0% women, 10% women, etc.
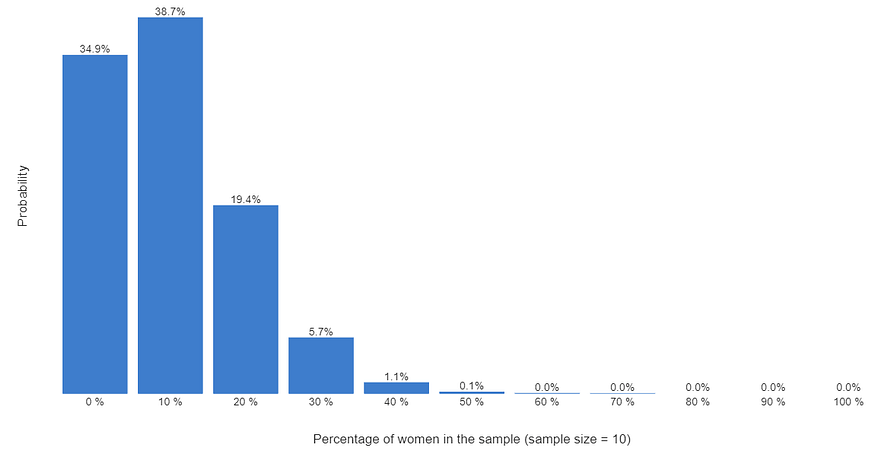
What we really want to know is the true value in the population. Is it 10%, 5%, or 20%? Without talking to everybody we cannot know for sure, but we can make some inferences. We can see from the chart that if the true figure is 10% (which is what was assumed when creating the chart), there is a 34.9% chance of observing 0% women, 38.7% chance of observing 10% women, and 19.4% chance of observing 20% (2 or fewer) women. If we add these up, we can say if the true value is 10%, there is 93% chance that we would observe either 0%, 10%, or 20% – and virtually no chance of observing a sample of more than 40% female.
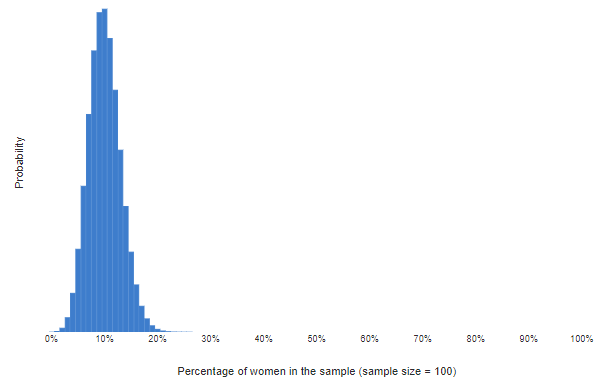
The next chart shows the calculations again, this time for 100 people. This chart tells us that if it was true that 10% of Stack Overflow visitors were female, then we could be confident of observing a value in a sample of 100 between 0% and 20%.
The actual Stack Overflow survey question about gender was answered by 35,990 people. Using the same math again, we can be extremely confident that if the truth is that 10% of all people on Stack Overflow are women, sampling error will mean that we observe a value between 9.4% and 10.5%. “Extremely confident” here means that there is a 99.9% probability that we would observe a value between 9.4% and 10.5%. Here, 9.4% and 10.5% are called the 99.9% confidence interval.
The role of sample size
As has been illustrated above, the bigger the sample size, the smaller the sampling error. The sampling error increases in proportion to the square root of the sample size. For example, when sample size is increased from 10 to 100, the sampling error halves, all else being equal.
The sampling method
In the calculations above, it was implicitly assumed that the samples were selected randomly (i.e., a simple random sample). With other types of samples, the math works differently. For example, with cluster sampling, the degree of sampling error is larger.
The inherent variability in the population
The example above investigated the sampling error for a proportion (i.e., a percentage). When investigating the sampling error for a mean (i.e., the average), we need to factor into the calculation the inherent variability in the population. The more variability, the greater the sampling error. For example, just as people vary more in their weights than their heights, the sampling error for weights is bigger than for heights.
The population size
The calculations above implicitly assumed an infinite population size. This assumption is rarely correct. If we modify the math to take into account the population size, the math gets more complicated. We see that the smaller the population, the smaller the sampling error. However, this effect is negligible unless the sample size is greater than 10% of the population size, so the effect of sample size can be safely ignored in most analyses.
Need to know more market research terminology? Brush up with our “What is” guides.