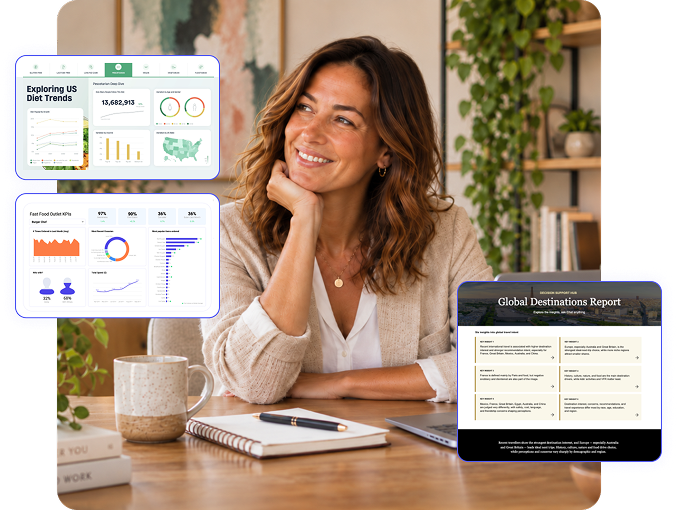
Create market research reports that auto-update, then interrogate the findings using Chat – with all answers linked back to the evidence. Displayr is the number one reporting platform for market researchers and consumer insights professionals – helping you build client-ready AI-powered PowerPoints, dashboards and live documents.
One report your stakeholders can read, explore, or question
Create market research reports fit for the AI age. Allow internal and external stakeholders to explore key findings via commentary that is written from the underlying analysis. They can also explore the findings with interactive filters and navigation, which lets them easily cut by age, region or wave without coming back to you.
Truly differentiate your reports from your competitors with built-in chat. Stakeholders ask whatever your findings don’t cover and get an answer from the data behind the report — no licence, and no email to you. Plus every number traces back to the crosstabs, tests, weights and variables behind it, including the answers chat gives.
Integrate AI across your reporting workflow
Displayr’s AI helps you produce better market research reports in three main ways:
By building the analysis. It finds the variables relevant to your question, builds the tables and charts, and offers numbered suggested actions you can run by typing the number. It also handles the slow parts – categorising open ends and coding verbatims. See our Research Agent for more.
Producing the report. Templates, branding and automated updates mean the deck or dashboard assembles itself each wave.
Allowing you and your clients to ask questions of the data after delivery. Report Chat keeps working once the report is published, meaning you can challenge the data and trust the results when it comes time to make decisions.
Standardized reporting with Skills
Encode branding, standards, and everything else that make your reports unique with Skills. Every research team has standards, but they tend to live in the heads of the people who set them — meaning adherence to these standards can vary from report to report.
Skills close that gap by standardizing your entire reporting methodology. Apply the same hex codes, logo placement, and chart styles on every project, so each wave comes back the same.
Built for Market Researchers
Generic BI and reporting tools treat survey data like any other spreadsheet. They don’t understand weighting, they can’t run significance testing out of the box, and they have no concept of a wave.
Displayr speaks the language of research – .sav files, survey structures, weighted data, stat testing, variable sets and tracking waves. That’s what makes the automation trustworthy: a report that rebuilds itself is only useful if the numbers it rebuilds are the ones you’d have calculated by hand.
See what your market research software should do
Start a free trial and run your own data through Displayr or book a demo and we’ll show you how research teams cut analysis and reporting time in half.
Life without Displayr would be like going back to the dark ages. I don’t even want to imagine it.
Michael Alborough
Founder, MAC Research
One complete platform to do it all
Statistical & Data Analysis
Crosstabs, sig testing, predictive modeling, segmentation, conjoint, MaxDiff, factor, PCA,
driver, weighting & data cleaning.
AI Insights & Automation
Text categorization, smart labeling, R code generation, AI-driven calculations, full report writing, prompt engineering, anomaly detection, and translation — all built in and ready to use.
Market Research
Tracking study automation, banner tables & custom weighting, automated data cleaning, data fusion & merging.
In 2026, AI reporting software generally covers the following use cases;
Automated production, where the report rebuilds itself when new data arrives.
Assisted analysis, where AI helps build the analysis in the first place.
Conversational reporting, where the published report answers questions from the people reading it. Displayr does all three.
What reporting formats can I deliver with AI reporting software?
PowerPoint, Excel, PDF, image files, embeds, interactive dashboards, and published web pages can all be created with AI reporting software tools like Displayr.
How is this different from a BI tool?
BI tools treat survey data as a generic spreadsheet. They don’t handle weighting, they don’t run significance testing out of the box, and they have no concept of a tracking wave. Reporting automation is only worth having if the numbers it produces are the ones you’d have calculated yourself.
Can viewers of a published dashboard ask their own questions?
Yes. Report Chat is enabled when you publish a document as a web page, and it runs in view mode, so the people reading the report can question it directly.
Do stakeholders need a Displayr licence to ask questions?
No. Report Chat runs on the published dashboard, so the people reading the report can use it without their own licence.
How is Report Chat different from a dashboard filter?
A filter answers the questions you anticipated when you built the dashboard. Report Chat works against the underlying survey structure, so it can answer a cut you never built a filter for.
Does AI reporting cost extra?
No. It’s part of Displayr rather than a separate AI add-on. You can find up-to-date pricing information for your region on our pricing page.