From raw data to the finished report – in one platform. Displayr is the market research software built for everything after data collection. Clean your data, run the analysis, build interactive dashboards, and produce reports that update themselves – without switching tools or writing code.
Survey data to insights and reports
All in one place
The market research software built for analysis and reporting
Bring in data from wherever you collect it – Qualtrics, SPSS, Excel, SQL, or any other source – and Displayr takes it the rest of the way: analysis, visualization, dashboards, and reporting, all in one place. No exporting between tools. No rebuilding charts by hand. No waiting on a developer.
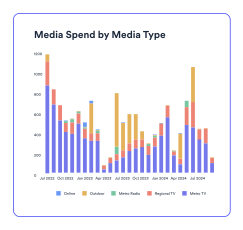
Visualize: Turn tables into clear, on-brand charts and visualizations in a few clicks. Everything stays connected to your data, so a change in the analysis flows straight through to the chart.
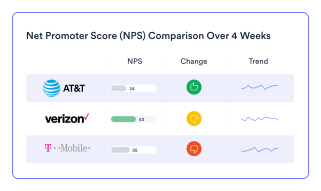
Dashboard: Build live, interactive dashboards directly from your survey data. Let stakeholders drill down into the results themselves and find the story without coming back to you for every cut.
Report: Produce full PowerPoint reports that update automatically when your data changes. Run a new wave, refresh the data, and every table, chart, and slide updates itself. Reporting stops being a manual rebuild and becomes a single click.
Built for market researchers
Generic BI and analytics tools treat survey data like any other spreadsheet. They don’t understand weighting, they can’t run significance testing out of the box, and they leave the hardest parts of research analysis up to you.
Displayr is different. It’s a market research analysis platform that speaks the language of research – survey structures, weighted data, stat testing, and the advanced methods (MaxDiff, conjoint, segmentation) that serious research depends on. The result: less time wrestling with tools, more time finding insights.
AI-powered market research software
Displayr’s AI does the groundwork so you can focus on the thinking. Upload your data and Displayr analyzes it, suggests the research questions worth asking, builds the charts and dashboards, and drafts the strategic recommendations – then you change anything you disagree with.
Because it’s built for survey data, grids, multi-response, and weighting are handled from the start rather than worked around. You get to a defensible answer faster, with the statistical rigor research demands.
See what your market research software should do
Start a free trial and run your own data through Displayr or book a demo and we’ll show you how research teams cut analysis and reporting time in half.
Life without Displayr would be like going back to the dark ages. I don’t even want to imagine it.
Michael Alborough
Founder, MAC Research
One complete platform to do it all
Statistical & Data Analysis
Crosstabs, sig testing, predictive modeling, segmentation, conjoint, MaxDiff, factor, PCA,
driver, weighting & data cleaning.
AI Insights & Automation
Text categorization, smart labeling, R code generation, AI-driven calculations, full report writing, prompt engineering, anomaly detection, and translation — all built in and ready to use.
Market Research
Tracking study automation, banner tables & custom weighting, automated data cleaning, data fusion & merging.
Market research software is a platform that helps businesses collect, analyze, visualize, and report on customer, market, and survey data. It is used to collect information and turn raw research data into insights through tools for surveys, statistical analysis, dashboards, text analysis, and automated reporting.
What makes Displayr different from other market research software?
Most tools focus on collecting data. Displayr is built for everything after — analysis, dashboards, and reporting. It includes the statistical methods researchers use daily (crosstabs, significance testing, MaxDiff, conjoint, driver analysis, segmentation) with no code required, and connects to data from Qualtrics, SPSS, Excel, and more.
Can Displayr automate market research reporting?
Yes. Displayr builds PowerPoint reports and interactive dashboards that update automatically when your data changes — so you don’t rebuild them by hand every wave.
For the recurring-reporting workflow specifically — weighted crosstabs, significance testing and a deck that rebuilds each wave — see survey reporting.
Do I need to know how to code to use Displayr?
No. Displayr is no-code by default, with drag-and-drop analysis and visualization. Advanced users can also add R code for custom analysis when they want it.
What data sources does Displayr work with?
Displayr connects to the tools you already use — Qualtrics, SPSS, Excel, SQL databases, and more — so you can analyze data no matter where it was collected.
What is the best software for market research?
The best software for market research is the tool that can collect and interpret data relevant to your industry and turn it into insights with the most reliability. That reliability comes from the analysis layer – and it’s where Displayr specialises: real statistical methods (weighting, significance testing, drivers) applied to your survey data, with every number traceable back to its source. For a full comparison, see our guide to the top market research analysis tools.
Can ChatGPT do market research?
General AI tools can summarise findings and draft questionnaires, but they can’t run the statistics market research requires – weighting, significance testing, crosstabs – and their answers can’t be audited against your data. You can read a full breakdown on the effectiveness of ChatGPT for data analysis and some alternatives here.
Are you AI-ready?
Meet with us to find the gaps and see where AI can give you an edge.