

Auto correlation is a characteristic of data which shows the degree of similarity between the values of the same variables over successive time intervals. This post explains what autocorrelation is, types of autocorrelation - positive and negative autocorrelation, as well as how to diagnose and test for auto correlation.
When you have a series of numbers, and there is a pattern such that values in the series can be predicted based on preceding values in the series, the series of numbers is said to exhibit autocorrelation. This is also known as serial correlation and serial dependence. The existence of autocorrelation in the residuals of a model is a sign that the model may be unsound. Autocorrelation is diagnosed using a correlogram (ACF plot) and can be tested using the Durbin-Watson test.
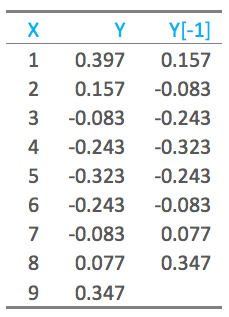
The auto part of autocorrelation is from the Greek word for self, and autocorrelation means data that is correlated with itself, as opposed to being correlated with some other data. Consider the nine values of Y below. The column to the right shows the last eight of these values, moved “up” one row, with the first value deleted. When we correlate these two columns of data, excluding the last observation that has missing values, the correlation is 0.64. This means that the data is correlated with itself (i.e., we have autocorrelation/serial correlation).
Positive and negative autocorrelation
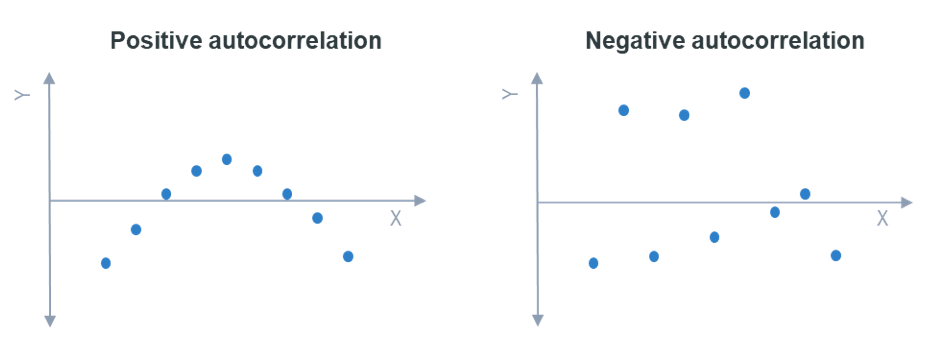
The example above shows positive first-order autocorrelation, where first order indicates that observations that are one apart are correlated, and positive means that the correlation between the observations is positive. When data exhibiting positive first-order correlation is plotted, the points appear in a smooth snake-like curve, as on the left. With negative first-order correlation, the points form a zigzag pattern if connected, as shown on the right.
Diagnosing autocorrelation using a correlogram
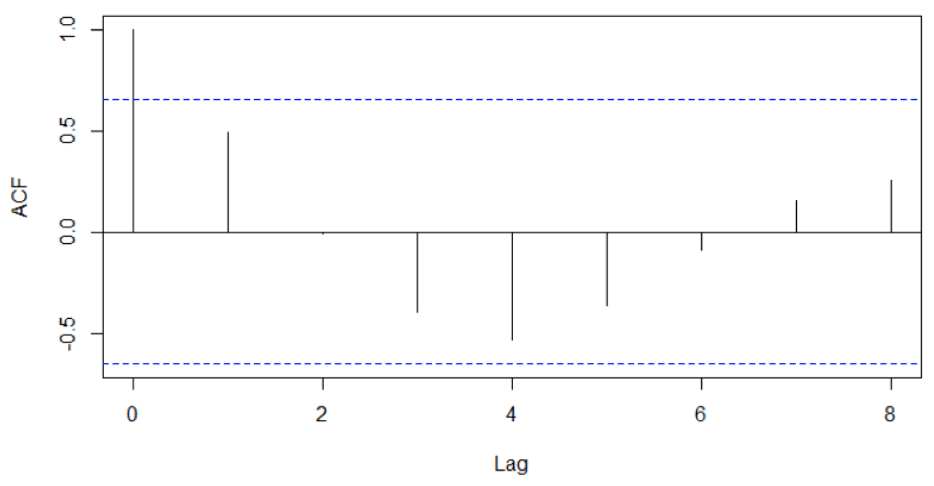
A correlogram shows the correlation of a series of data with itself; it is also known as an autocorrelation plot and an ACF plot. The correlogram is for the data shown above. The lag refers to the order of correlation. We can see in this plot that at lag 0, the correlation is 1, as the data is correlated with itself. At a lag of 1, the correlation is shown as being around 0.5 (this is different to the correlation computed above, as the correlogram uses a slightly different formula). We can also see that we have negative correlations when the points are 3, 4, and 5 apart.
Testing for autocorrelation
Sampling error alone means that we will typically see some autocorrelation in any data set, so a statistical test is required to rule out the possibility that sampling error is causing the autocorrelation. The standard test for this is the Durbin-Watson test. This test only explicitly tests first order correlation, but in practice it tends to detect most common forms of autocorrelation as most forms of autocorrelation exhibit some degree of first order correlation.
The implications of autocorrelation
When autocorrelation is detected in the residuals from a model, it suggests that the model is misspecified (i.e., in some sense wrong). A cause is that some key variable or variables are missing from the model. Where the data has been collected across space or time, and the model does not explicitly account for this, autocorrelation is likely. For example, if a weather model is wrong in one suburb, it will likely be wrong in the same way in a neighboring suburb. The fix is to either include the missing variables, or explicitly model the autocorrelation (e.g., using an ARIMA model).
The existence of autocorrelation means that computed standard errors, and consequently p-values, are misleading.
To start running your own auto correlations in Displayr, get started below.