


Many researchers like to add value for their clients by getting beyond the observed data and creating new or interesting analyses from it. Along with good problem-solving skills, this type of analysis requires a degree of fluidity and working iteratively
Some try and do this via writing code, but this can be a struggle. For most, Excel is the app of choice, it’s very flexible and easy to use and therefore an efficient way of creating custom analysis.
But how much more efficient would it be if your bespoke analysis was embedded in your report and accessed the data directly?
Displayr’s Calculations menu makes this possible.
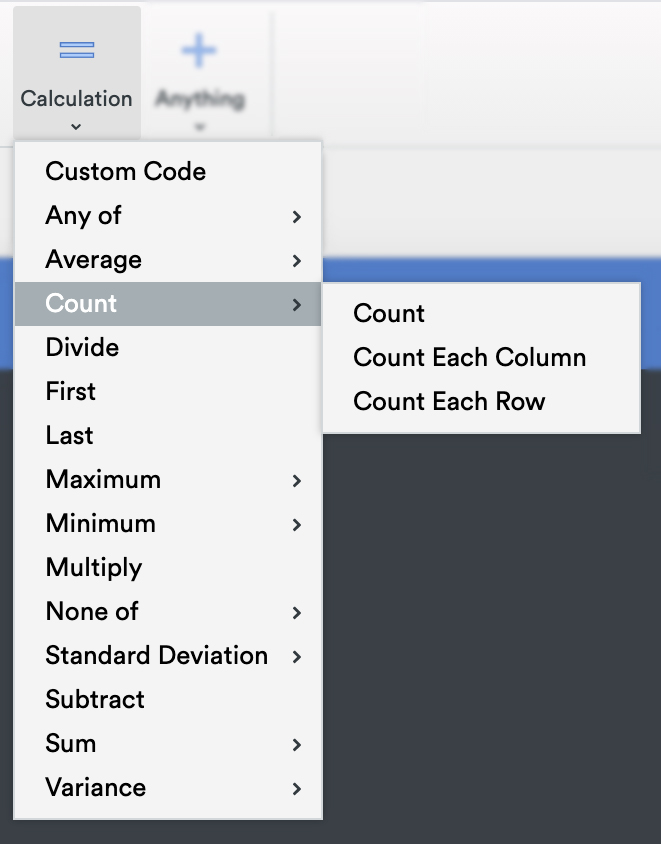
Accessing Calculations
The Calculations functions are accessed from the tool bar using the button with the same name. There is already and extensive range of functions and we regularly add more.
For those comfortable writing formulas using code, you can also press the “=” part of the button and drag a placeholder for a calculation on to the page. The code editor opens and you can type in a formula.
Calculations in Action
The possibilities for using calculations are endless. Here are four examples of how calculations can be used, which should get the creative juices flowing.
Calculating a New Variable
This creates a custom variable from a subset of brands in a numerical survey question, using the “Sum” function. Once created, variables like this can be linked to tables, charts and other visualizations. They can be duplicated or edited to create more variables of interest.
Simple Custom Calculations
This begins by making some simple custom calculations using basic code then applying these to a table of data. We then show how to perform the same operation with out code, using Displayr’s built in functionality.
Calculations from a Table
Here we take a cross tab and selectively calculate the sum for each row. The calculations can be sorted in rank order and hold. If we make changes to the source table, these are also reflected in the calculations.
There are setting in Displayr to give you more control over your calculations. Using this example, you can be even more selective, specifying specific columns to leave out of the calculation. Just select the calculation and find “Columns to exclude” in the object inspector.
Calculations from Multiple Tables
This uses a range of Displayr’s calculations to create all the inputs required for a classic marketing framework, the BCG Matrix. One the matrix is set up, it is easy to repurpose – brand inputs can be changed and the calculations and the matrix visualization all update instantly. Filter can be set up and dynamically linked to the source data – calculations change dynamically with each filter change.
Turbo-charge your analysis with Calculations
Displayr’s Calculations allow you to customize your analysis, making it easy to go beyond the observed data without having your workings somewhere else. You can easily change and manipulate calculations once they are set up, everything is connected. This saves you time, which you can then use to apply your thinking to even more bespoke calculations!
