


Displayr has a large and growing library of automated variable creation options. This library now includes the ability to automate combining the data contained within certain types of variables into new and interesting categories:
- Transform numeric variables into useful categorical variables
- Combine or collapse categorical variables into meaningful groups based on patterns in the data
- Convert information like Zip or Postal Codes into logical geographic areas
This automation can save you a lot of time. Most importantly, these functions make relationships in data clearer, to help sharpen your analysis and story building.
Displayr users can find and explore these features in Ready-Made New Variables > Automatically Combine Categories. Here are a few examples to bring these features to life…
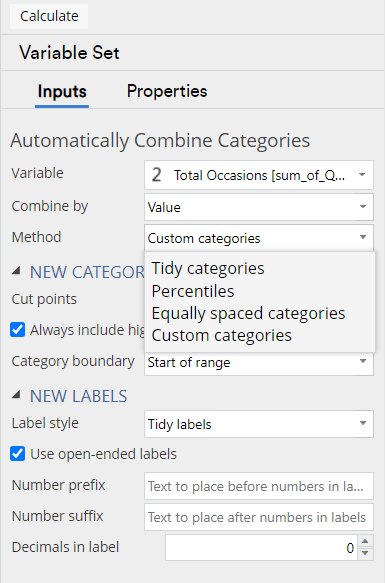
Create Categories Based on Data Values
Select a numeric variable as input and have a high degree of flexibility in how you transform it – you can automatically create data-driven tidy categories, percentiles, equally spaced categories (where you can control the increments), or custom categories. Custom categorization allows you to enter pre-defined ‘cut-points’ – the variable is created without having to use code or make manual edits. Displayr can also automate the Label style, with a range of options dependent on the categorization method selected.
In this video we create a complex numeric variable and transform it using a range of these methods:
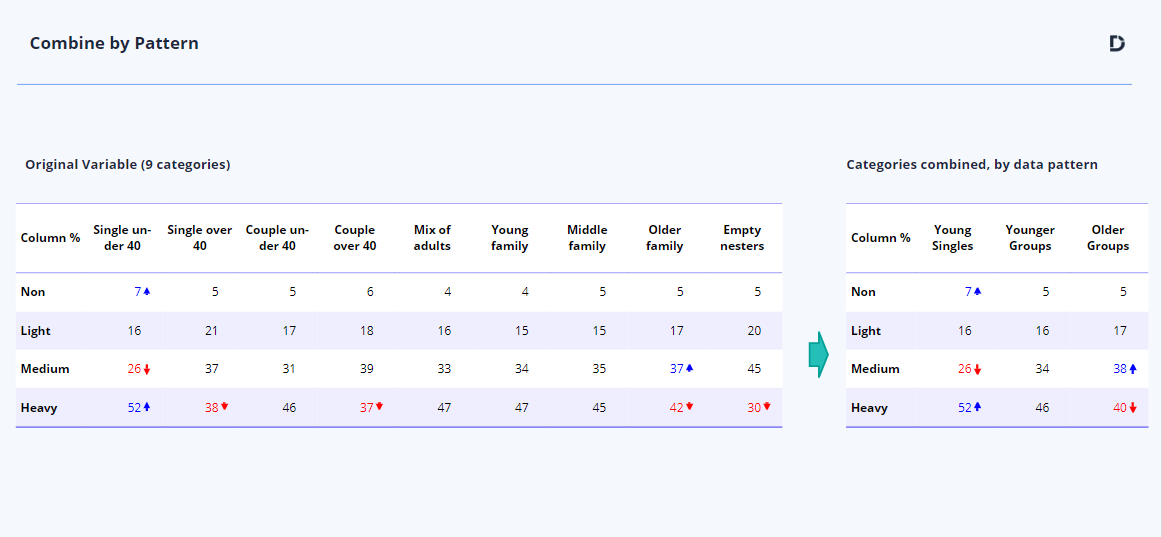
Combine or Collapse Categories based on Patterns in Related Data
This option will automatically collapse categories in the input variable based on the statistical relationships to another variable. It does this using CHAID (Chi-Squared Automatic Interaction Detection). Simplifying the variable of interest gives the analysis a lot more focus, providing insight and promoting actionability.
In this example, looking at the impact of household structure on category consumption frequency, we started with 9 categories that indicated some relationships in the data and automatically transformed that to 3 categories where the relationships are abundantly clear. ‘Young Singles’ is the primary demographic segment of interest and ‘Younger Groups’ is the secondary segment of interest.
In Displayr, select Ready-Made New Variables > Automatically Combine Categories > By Pattern (CHAID). When working with ordinal variables you can force the function to only collapse adjacent categories.
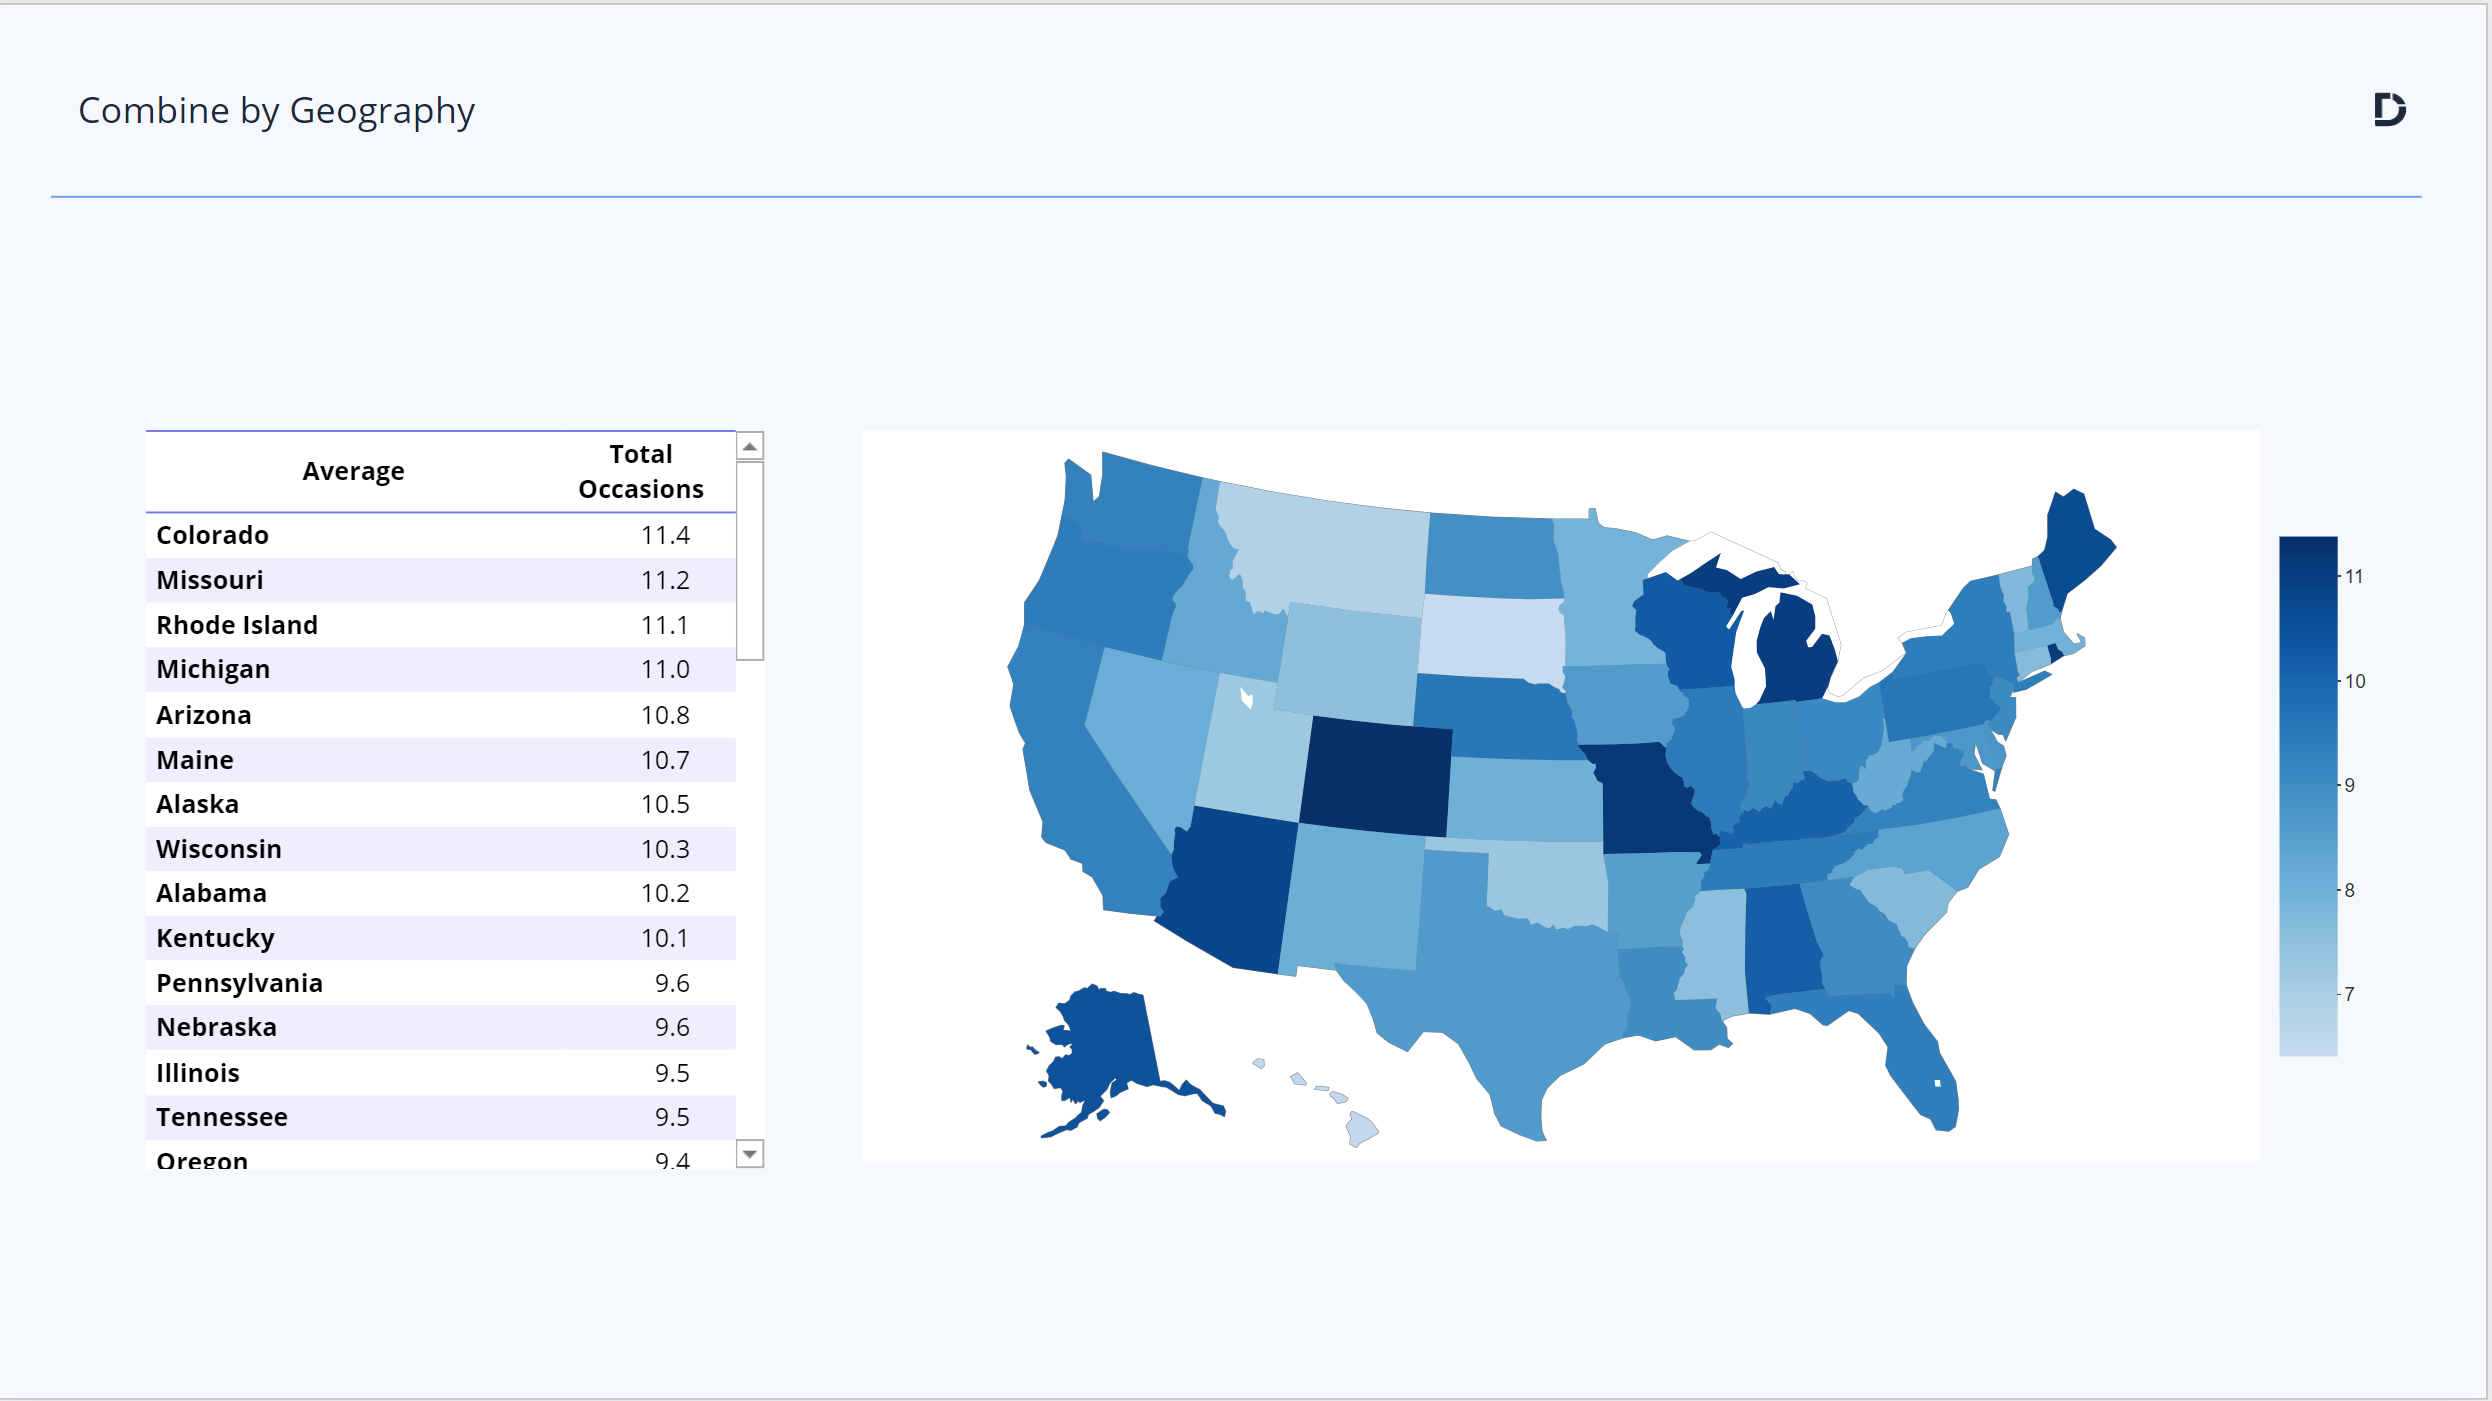
Convert one type of Geographic Data into Another
The proliferation of online research and the integration of survey research with CRM systems has led to much larger sample sizes. This brings into play geographic variables like ZIP or postal codes. Displayr has functionality to transform these and other types of geographical data for North America, Europe, Australia and New Zealand. This geographic heat map was created from scratch, combining ZIP code and category frequency data, in less than 2 minutes.
You can see the steps in this video:
Explore Automatic Combinations now!
Existing customers will quickly see how much time they can save and how much power they can add to their analysis using the automated functions to combine numeric, categorical, and geographic data. Anyone else can book a demo or take a free trial.