

You can take your correspondence analysis plots to the next level by including images. Better still, you don’t need to paste in the images after the analysis is complete – you can include them right from the start.
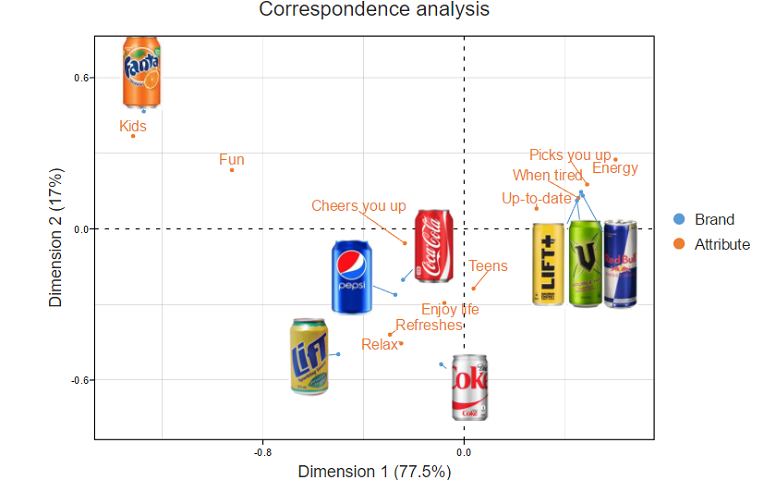
The plot above shows the results of a correspondence analysis based on data from a study of how people perceive different carbonated soft drinks. Logos, which are from jpeg files, are shown instead of brand names, with lines and dots indicating the precise location of the brands. This post describes how to create this plot using R.
If you want to quickly create your own correspondence analysis, you can plug your own data into this template.
Create your own Correspondence Analysis
Step 1: Installing the packages
The first step is to install the flipDimensionReduction package and a series of dependent packages, which are listed below. Depending on how your R has been setup, you may need to install none of these (e.g., if using Displayr), or you may need to install more packages.
install.packages("devtools")
library(devtools)
install_github("Displayr/flipChartBasics")
install_github("Displayr/flipData")
install_github("Displayr/flipDimensionReduction")
install_github("Displayr/flipExampleData")
install_github("Displayr/flipFormat")
install_github("Displayr/flipImputation")
install_github("Displayr/flipPlots")
install_github("Displayr/flipStatistics")
install_github("Displayr/flipTransformations")
install.packages("GPArotation")
install.packages("plotly")
install.packages("psych")
install_github("Displayr/rhtmlLabeledScatter")
install_github("Displayr/rhtmlMoonPlot")
Step 2: Create the images
The next step is to create some images of similar sizes and have the files hosted somewhere. The function that creates the correspondence analysis expects URLs rather than local files.
Step 3: Create a data table
The main input to the correspondence analysis is a table of data. I have used data from the flipExampleData package, giving the table a name of csd.
data(csd.perceptions, package = "flipExampleData")
csd = csd.perceptions * 100
Step 4: Use CorrespondenceAnalysis
Next, we call the CorrespondenceAnalysis function. Here, we use the default arguments, other than telling it we want a scatterplot, and passing in the logos that we want to display:
library(flipDimensionReduction)
CorrespondenceAnalysis(csd,
 output = "Scatterplot",
 logos = c("https://docs.displayr.com/images/9/90/Coke.png",
 "https://docs.displayr.com/images/7/7c/V.jpg",
 "https://docs.displayr.com/images/8/82/RedBull.jpg",
 "https://docs.displayr.com/images/d/dc/LifePlus.jpg",
 "https://docs.displayr.com/images/0/09/DietCoke.png",
 "https://docs.displayr.com/images/d/da/Fanta.jpg",
 "https://docs.displayr.com/images/e/e8/Lift.png",
 "https://docs.displayr.com/images/5/5e/Pepsi.jpg"))
If you check the help for this function, you will find parameters for lots of different types of customization, including resizing the logos, adding titles, etc.
Step 5: Rearrange any images using drag and drop
The resulting visualization, shown below, is an HTMLwidget, and the underlying d3 code allows you to drag and drop to rearrange the images and other labels. If you use Displayr to publish the R code, the state will be remembered (i.e., it will remember where you have moved things to).
To play around with the R code for this post in Displayr, click here.
The example in this post displays correctly in normal desktop installations of R for Windows, but due to a bug in R Studio does not render in their browser.
