Factor Analysis and Principal Component Analysis: A Simple Explanation

Got lots of variables? Need to condense the data into something your audience is going to be able to actually understand? Factor analysis/PCA is a great place to start. Find out how you can find patterns in your data faster and easier today.
What Is Factor Analysis & Principal Component Analysis (PCA)?
Factor analysis and principal component analysis identify patterns in the correlations between variables. These patterns are used to infer the existence of underlying latent variables in the data. These latent variables are often referred to as factors, components, and dimensions.
The most well-known application of these techniques is in identifying dimensions of personality in psychology. However, they have broad application across data analysis, from finance through to astronomy. At a technical level, factor analysis and principal component analysis are different techniques, but the difference is in the detail rather than the broad interpretation of the techniques.
Create your own factor analysis
A Worked Example
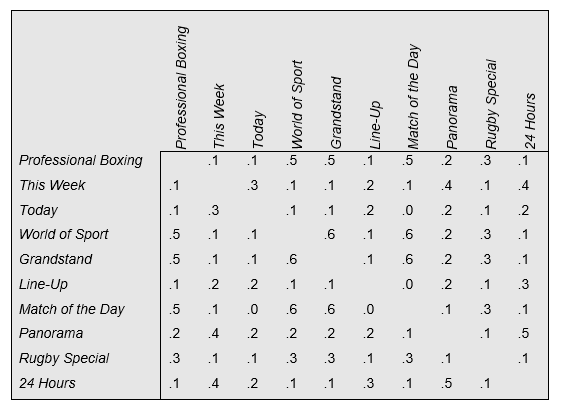
The table below shows a correlation matrix of the correlations between viewing of TV programs in the U.K. in the 1970s. Each of the numbers in the table is a correlation. This shows the relationship between the viewing of the TV program shown in the row with that shown in the column. The higher the correlation, the greater the overlap in the viewing of the programs. For example, the table shows that people who watch World of Sport frequently are more likely to watch Professional Boxing frequently than are people who watch Today. In other words, the correlation of .5 between World of Sport and Professional Boxing is higher than the correlation of .1 between Today and Professional Boxing.

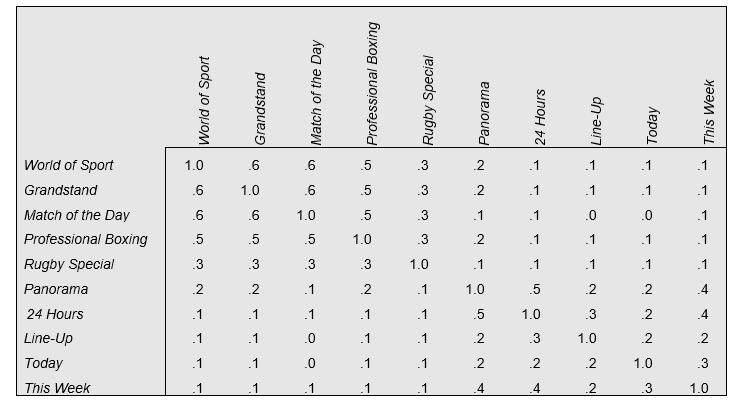
The table below shows the data again, but with the columns and rows re-ordered to reveal some patterns. Looking at the top left of the re-ordered correlation matrix, we can see that the people who watch any one of the sports programs are more likely to watch one of the other sports programs. Similarly, if we look at the bottom right of the matrix we can see that people who watch one current affairs program are more likely to watch another, and vice versa.

Where a set of variables is correlated with each other, a plausible explanation is that there is some other variable with which they are all correlated. For example, the reason that viewership of each of the sports programs is correlated with each other may be that they are all correlated with a more general variable: propensity to watch sports programs. Similarly, the factor that might explain the correlation among viewership of the current affairs program may be that people differ in terms of their propensity to view current affairs programs. Factor analysis is a statistical technique that attempts to uncover factors.
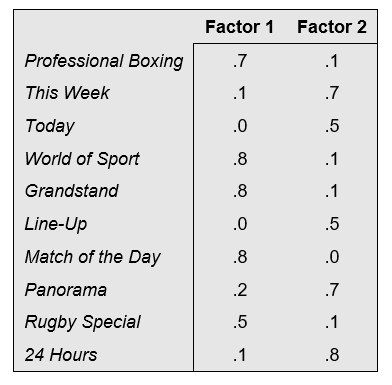
The table below shows the rotated factor loadings (also known as the rotated component matrix) for the U.K. TV viewing data. In creating this table, it has been assumed that there are two factors (i.e., latent variables). The numbers in the table show the estimated correlation between each of the ten original variables and the two factors. For example, the variable that measures whether or not someone watches Professional Boxing is relatively strongly correlated with the first factor (0.73) and has a slight correlation with the second factor (0.086). The first factor seems to be the propensity to watch sports and the second seems to be the propensity to watch current affairs.

When conducting factor analysis and principal component analysis, decisions need to be made about how many factors should be selected. By default, programs use a method known as the Kaiser rule. However, this rule is only a rule of thumb. It is often useful to consider alternative numbers of factors and select the cluster with the highest number of factors.
Create your own factor analysis
Factor Analysis vs PCA: The Key Differences
Although the terms 'factor analysis' and 'principal component analysis' are often used in conjunction, they are not actually the same thing. The mathematics of factor analysis and principal component analysis (PCA) are different. Factor analysis explicitly assumes the existence of latent factors underlying the observed data. PCA instead seeks to identify variables that are composites of the observed variables.
Although the techniques can get different results, they are similar to the point where the leading software used for conducting factor analysis (SPSS Statistics) uses PCA as its default algorithm. An easy way to think about it is to understand that PCA is one of many different variants of factor analysis.
Create your own factor analysis
Acknowledgements
The correlation matrix presented in this article is from Ehrenberg, Andrew (1981): “The Problem of Numeracy Article,” The American Statistician, 35(2):67-71.[/vc_column_text]
Now that you're more familiar with factor analysis and principal component analysis, you can create them quickly in Displayr.


