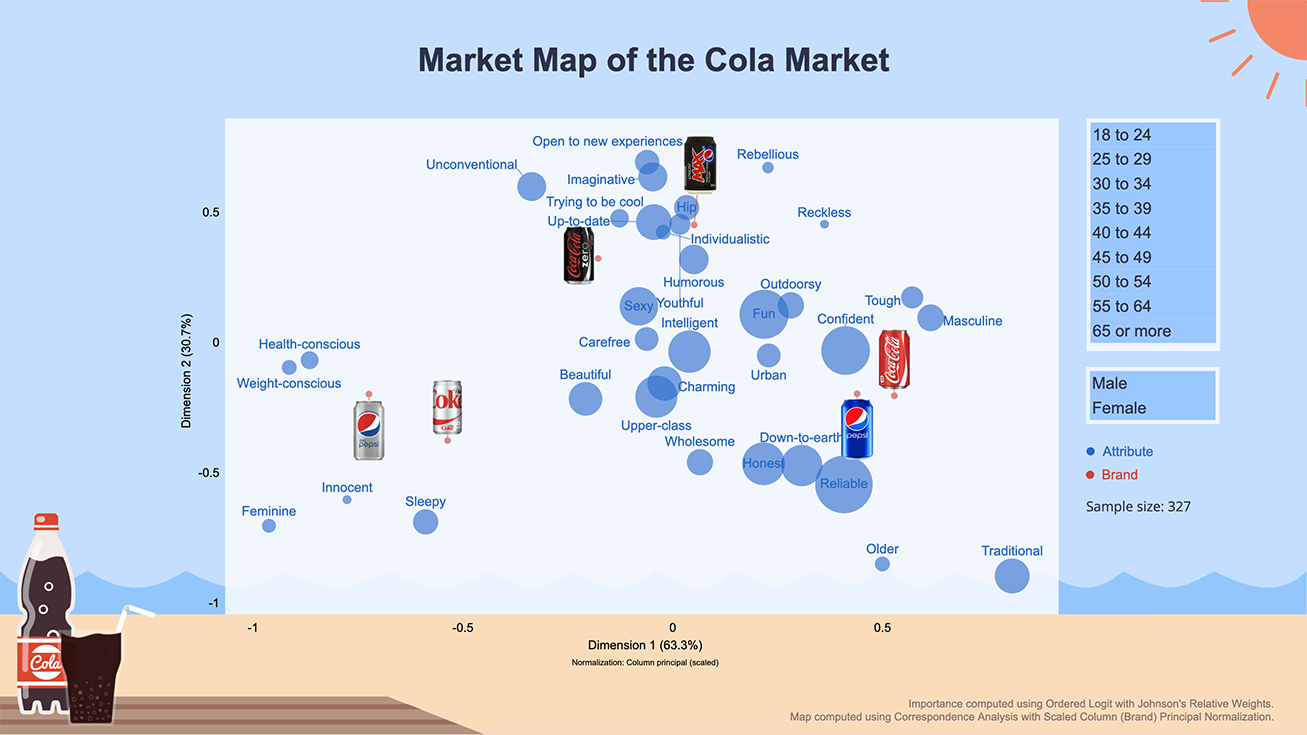
Looking for an awesome way to visualize market data? Check out this market map dashboard, featuring a cutting-edge correspondence analysis of six different cola brands! Correspondence analysis may seem tricky at first, but it’s actually super cool and easy to understand.
But that’s not all – this dashboard also includes bubble sizes to show the relative importance of each attribute as a driver for success. And the best part? It’s completely filterable with just a single click, allowing you to explore data by gender and different age categories.
Plus, it’s incredibly easy to update – just replace the data file with a new wave of data, and everything will be instantly updated, including analysis, visualizations, filters, weights, text summaries, and more!
At Displayr, we pride ourselves on making cutting-edge analysis tools that are easy to use and your clients will love. Why not make it simple for you clients to explore their data with interactive visualizations, drop-down menus, and pictographs – and let them discover new insights.
So why wait? Try building your own market map dashboard today and start unlocking the full potential of your survey data!