


Summary
Calculation grids allow you to add a new type of table onto a page, where the table can be a mix of text, values, or calculations, including links to other tables.
Calculation grids allow you to do things in Displayr that you previously would have had to do in Excel or PowerPoint.
How to use
Calculation grids are added from the Calculation menu in the toolbar. You can add data into a calculation grid by:
- Typing directly into it. If you want to type text, surround it by quotation marks (e.g., “my text”)
- Copying either data from another table, or part of a table, and right-clicking and choosing from the paste options.
Example use case
It’s often useful to create tables like the one below, which draw in data from multiple other tables.

These are now easy to do using calculation grids. The 2 minute demo video below runs through this use case.
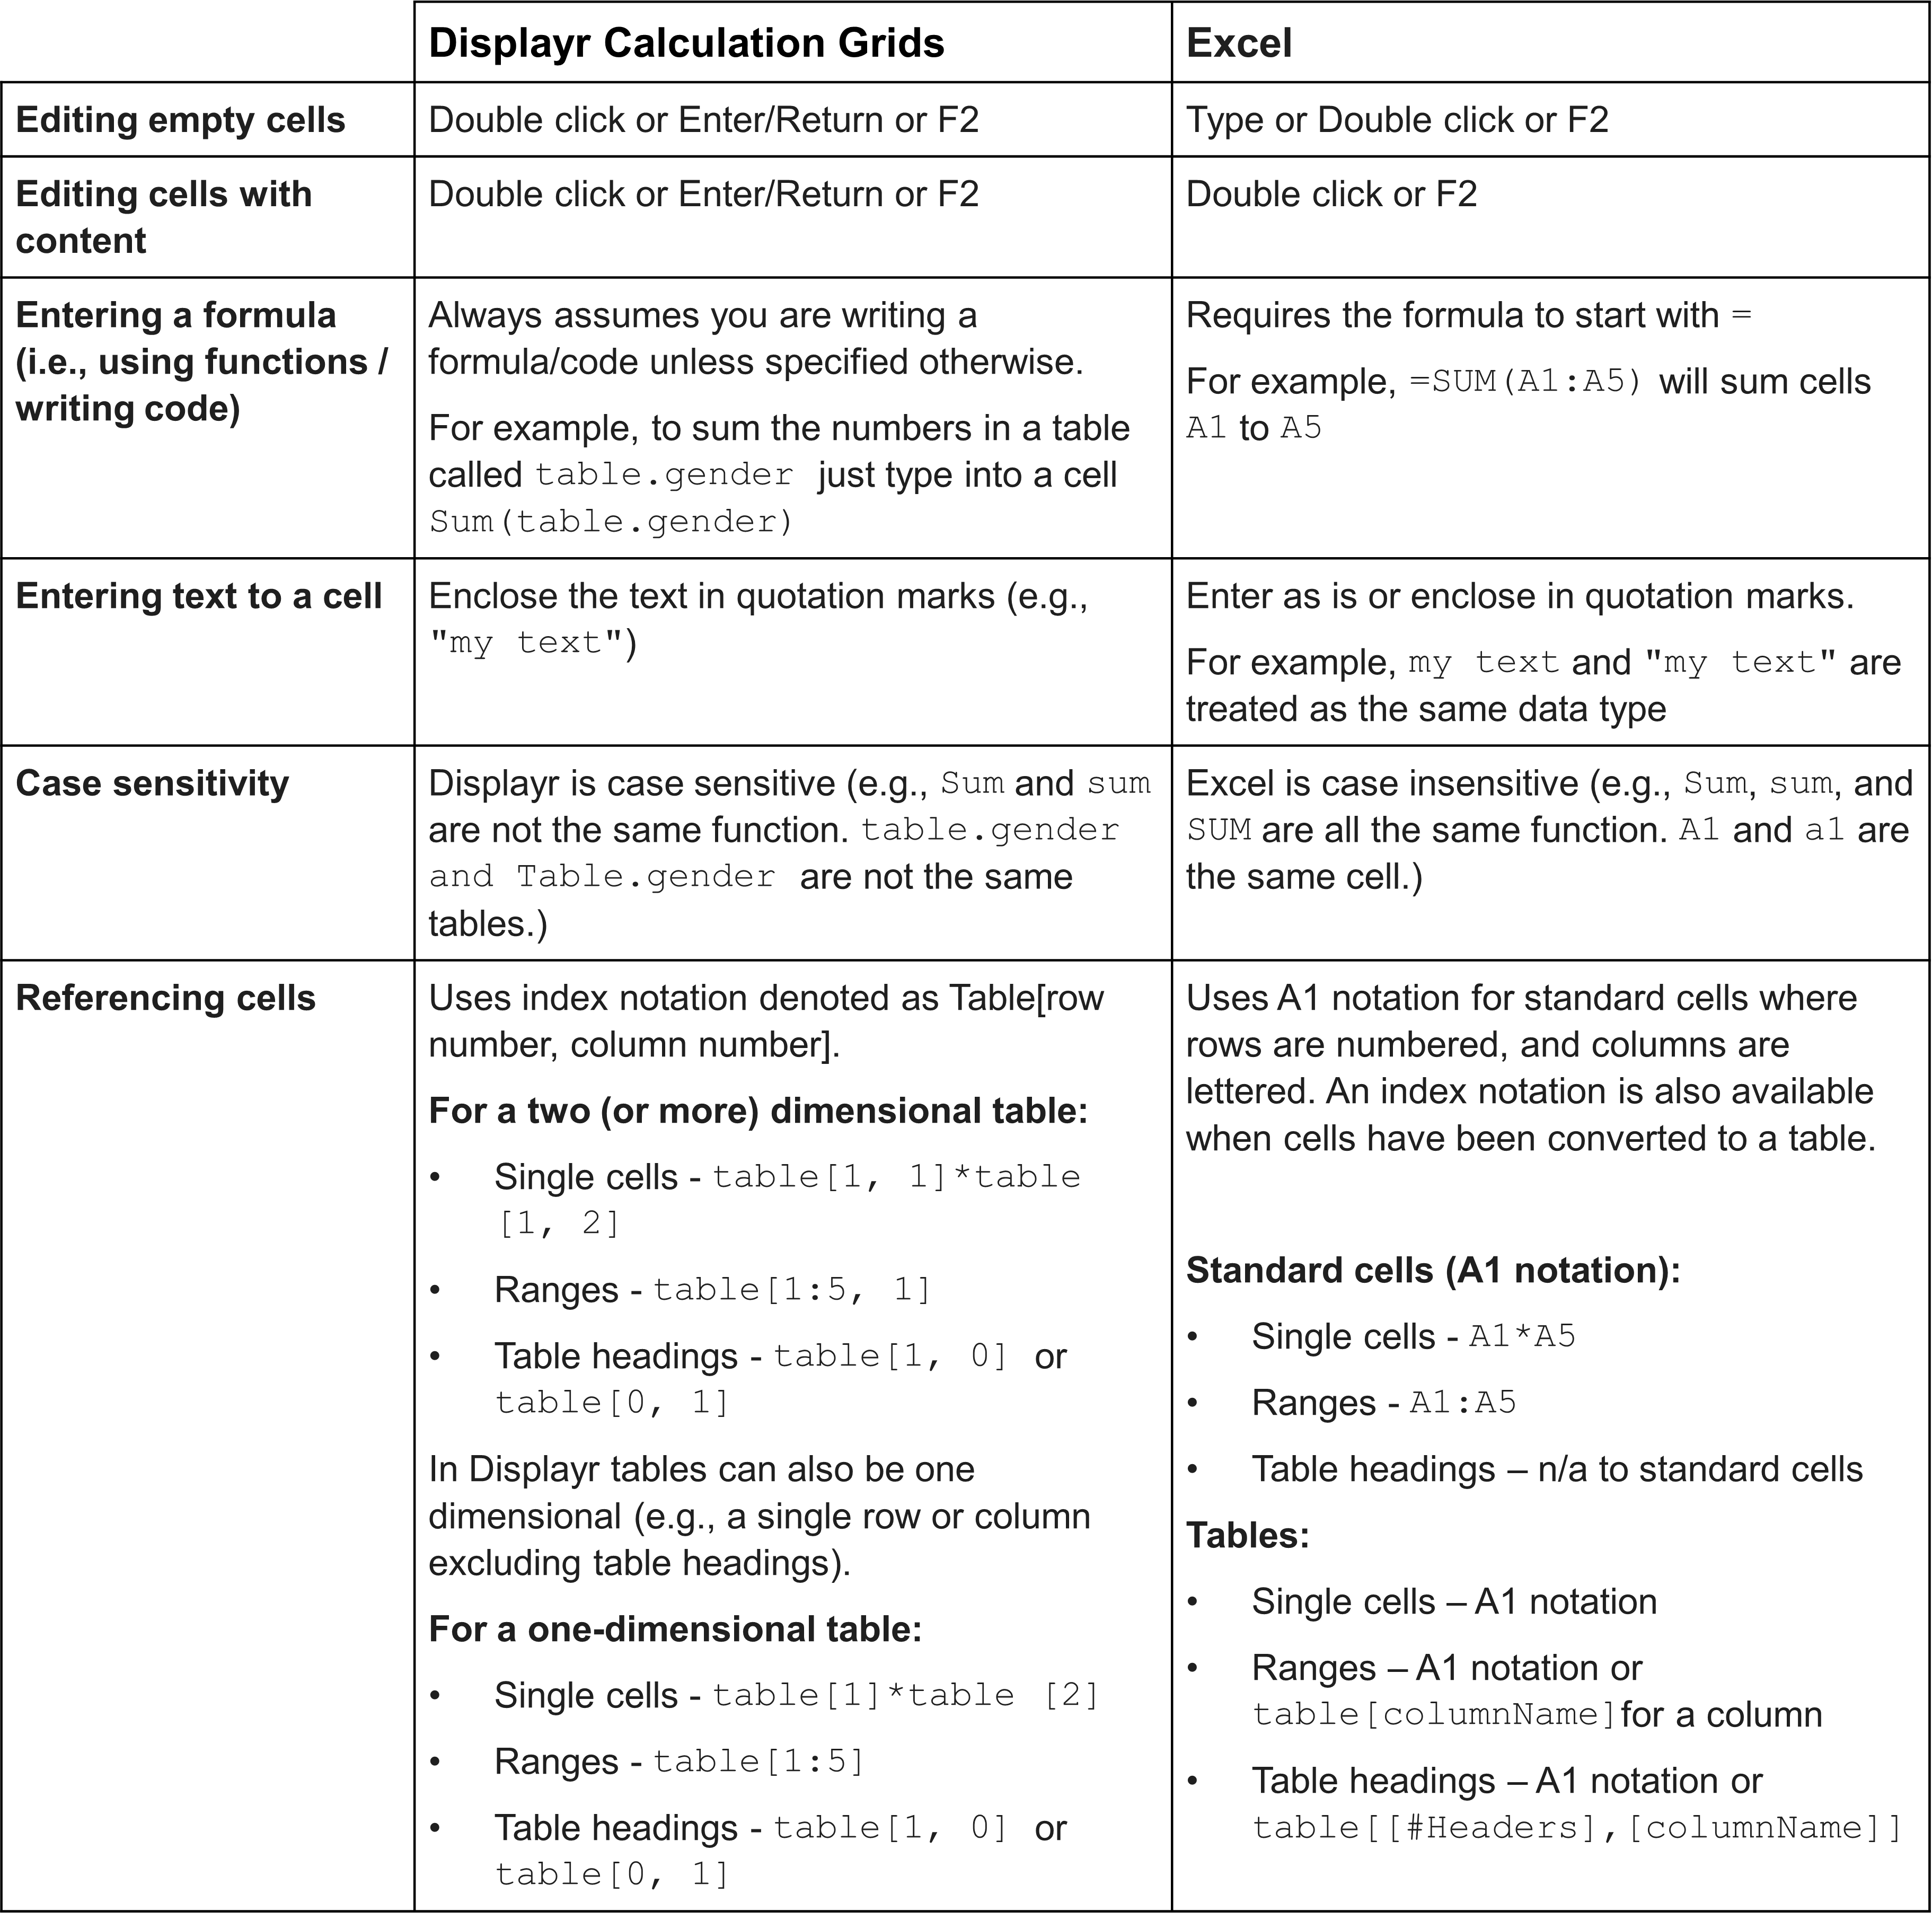
Key differences from Excel
Feature roadmap
- Custom formatting of individual cells (font, color, number format, borders)
- Custom row and column heights/widths
- Speed and performance of calculations
- Excel like updating of cell references when copying formulas across cells
- Custom Displayr R functions to simplify formula creation e.g. vlookups
We hope you find calculation grids to be useful and if you have any feedback or questions please reach out to us via the help menu in app
