How do you work with a graphic designer so they can help make your online dashboard beautiful? Building a great dashboard requires lots of different skills: data skills, engineering skills, and quantitative visualization skills to work out the best way of visualizing each piece of data. And importantly, design and UX skills to work out how the user should interact and how everything should appear.
It is rare that somebody has all of these skills so you may need to get some help in one or more of these areas. In this post, as a graphic designer who has worked on many online dashboards, I use my experience to provide a set of guidelines to help you work with graphic designers. So, together you can make your dashboard beautiful and useful.
Step 1: Work out the scope of the engagement with your graphic designer
You can ask a graphic designer to do any of the following. You always need to be clear about what you want.
- Aesthetics: background images, colors, fonts, font sizes, borders, backgrounds, etc.
- Which chart types should be used?
- Design the UX or interaction experience.
- How do users navigate (hyperlinks, tags, buttons)?
- What types of interactions are possible with each page? E.g., filtering, printing.
- What types of interactions are possible with each visualization? E.g., hover, selection, drag and drop, zoom.
- Create the overall plan for the dashboard. That is, work out which pages need to be created and what information is to be on each page.
- Create the dashboard from beginning to end, working with the end users, programming, manipulating data, etc.
Step 2: Create your brief
You will need a written brief for the graphic designer and the more specific the better. Although you may not want to cramp their creative style, this is not a good time to be vague. If you’re not specific enough, things tend to not work out so well.
The brief needs to be specific about the following:
- The end-users of the dashboards. For example, perhaps the end-users are marketing managers wanting to understand what people are saying about their brands on Twitter.
- What success looks like. For example, the goal may be to have the marketing managers log in every day to see what has changed.
- Some inspiration. Your dashboard is ultimately a web page, so find examples of websites that you want your online dashboard to look like. Think about if you want a dark background, a photo or an image. Websites like awwwards and designmodo provide lots of inspiration. Keep in mind that some background images might be compromised by interactive graphics that change size.
- What you like. Provide examples of online dashboards that you think are good. The closer they are to what you are really going to build the better. For example, don’t send a graphic designer a link to Poppy Field unless you have a lot of time and cash.
- What you expect the graphic designer to build on. For, example, if your goal is to just engage the dashboard designer to focus on aesthetics, you should ideally create the entirety of the dashboard to the best of your skills up front, and then give them the job of improving it.
- If your timing permits, break down the process into a series of stages. For example, first get the landing page right, then the first quarter of the pages, etc.
- Timings and processes:
- Start date.
- The date to receive the initial concepts from the graphic designer for the landing page.
- When you want to receive initial concepts from the graphic designer for the other pages (often it may make sense for this to be after the landing page has been agreed on).
- The date to receive final artwork after agreeing to concepts (or the final dashboard, if the brief is for the dashboard designer to build it).
- The process for updates (e.g., of data, fixing problems). This is only important if the designer has responsibility for building the online dashboard.
- Any specific design preferences you have. For example, flat designs vs. 3D renders.
- The specifics and format of required outputs. For example, if you are getting a graphic designer to focus on aesthetics, this may be something like:
- First, all concepts to be presented as JPGs or PDFs.
- Final artwork to be presented as:
- Backgrounds to pages: JPEGs 1024 by 700. These need:
- Tell the story well. (Of course, you need to tell them the story as a separate part of the brief, for this to mean anything).
- Be clean, clear, and interesting.
- Work well with charts on top of them.
- All other images to be provided as SVGs. For each pictograph, provide two images, one in the font color and one in the background color.
- Fonts to be standard web fonts.
- Backgrounds to pages: JPEGs 1024 by 700. These need:
Step 3: Select a graphic designer
To confidently choose the right graphic designer, you need:
- Examples of online dashboards they have worked on.
- Referrals. This is particularly important if you are wanting them to do anything other than aesthetics.
- An understanding of their pricing.
- An understanding of their timing.
Word-of-mouth recommendations are ideal if you have the right network. Otherwise, there are lots of online services, such as UpWork.
If you are just focused on getting help with the aesthetics, all you probably need to do is find a graphic designer whose work you like. However, if time and money permit, it can be useful to try to get prototypes from a few different dashboard designers. This is more important if you have a large project or a pipeline of repeat business.
If you are wanting to have the graphic designer create the entire online dashboard, you probably want to tender the work and need to have multiples of $10,000 to spend.
Step 4: Remember, it is an iterative process
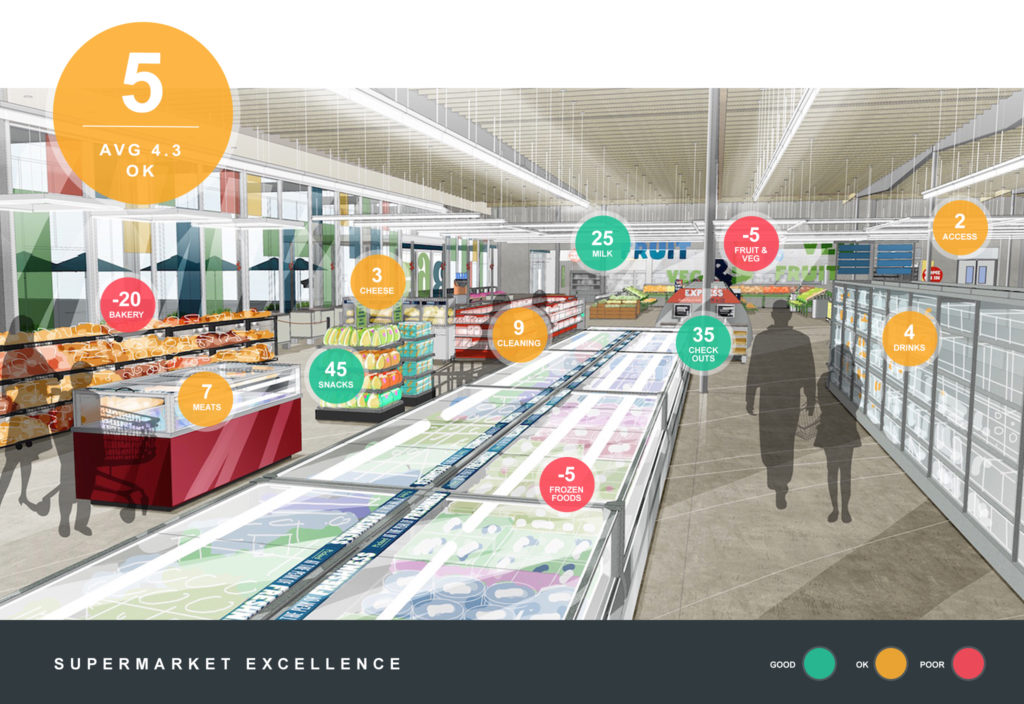
Nearly all design work is paid by the hour. This is not a task that works well with flat rate fees, except where the graphic designer has responsibility for doing everything. Next, I will walk you through a simple example, so you can understand what I mean by this. One of my colleagues gave me the brief of designing a landing page, which included the following example.
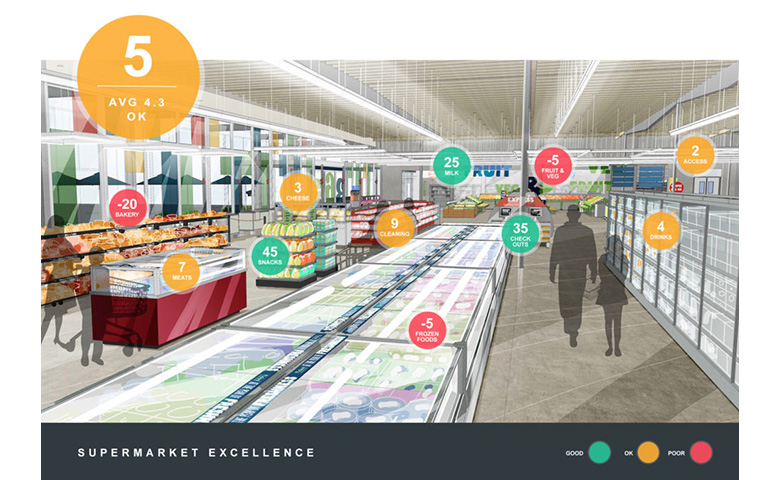
I got back to him with the following two options.
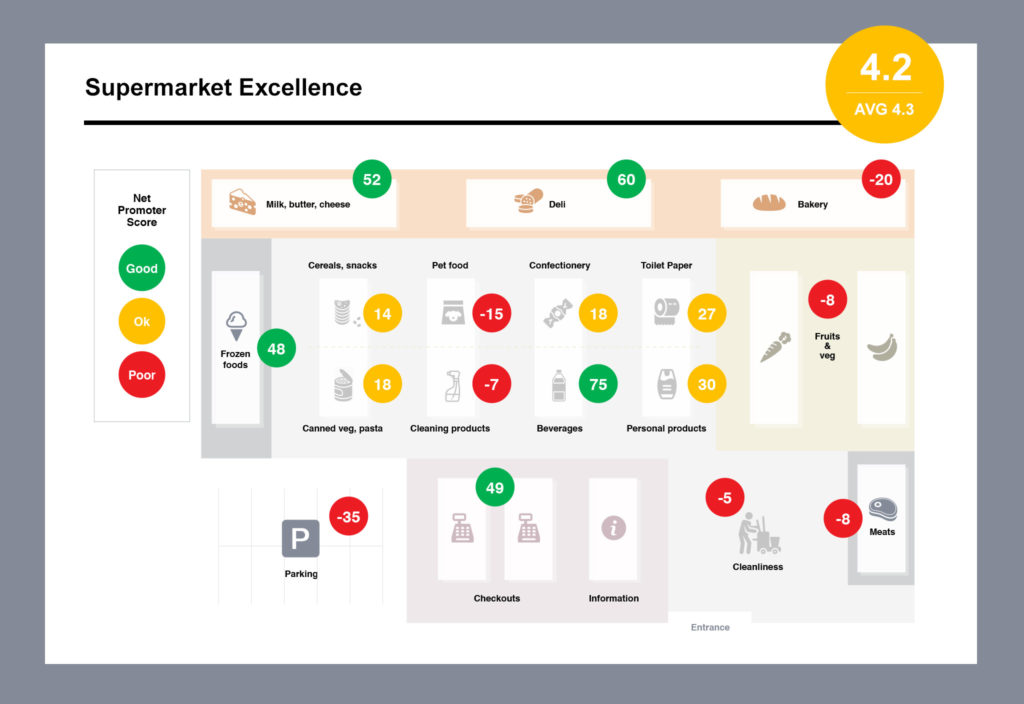
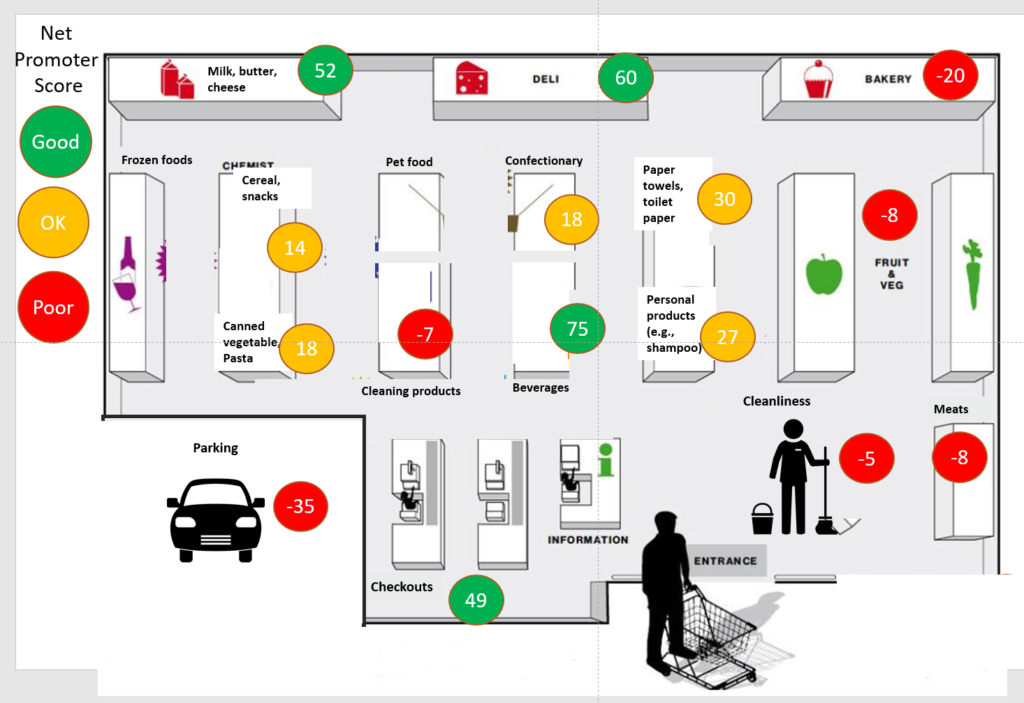
He didn’t like either of them. After a bit of back and forth, and a whole lot of mind reading, I ended up creating the design below. Consequently, the key thing to appreciate is that getting to this final stage was always going to be iterative. In other words, there is no way he could have given me a brief that got me straight there. And, there is no way I could have got there without a lot of feedback.