

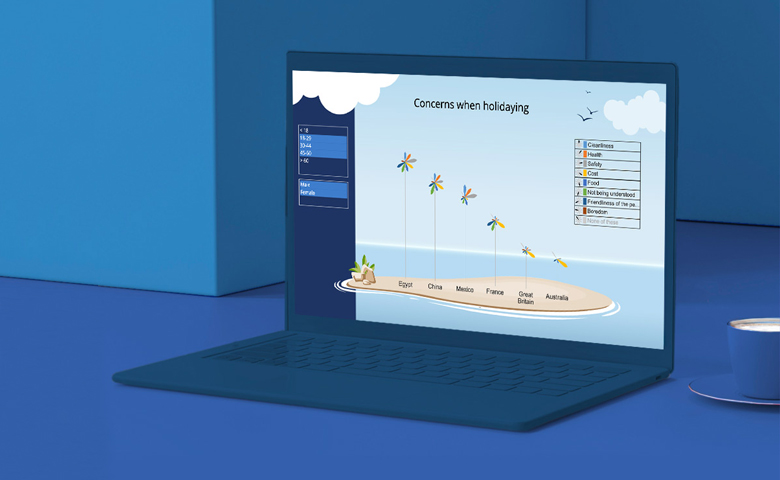
Dashboard 1: Traveler’s Concerns
Data file: Holiday Destinations and Attitudes.sav
Image file: Island.png
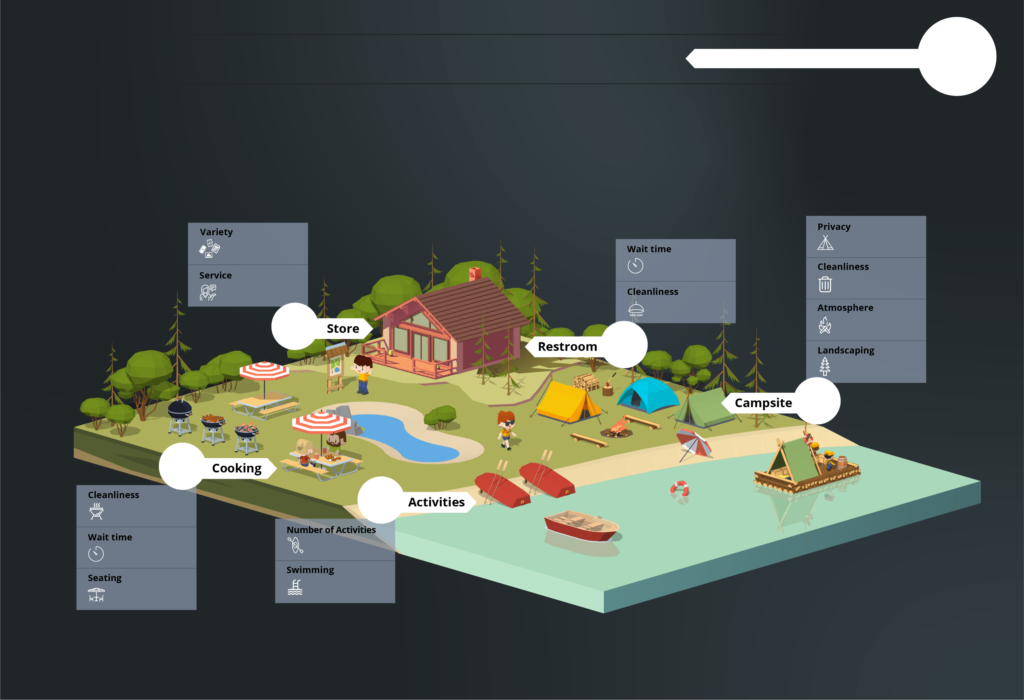
Dashboard 2: Campsite Performance
Data file: Camping Initial.sav
Image file: Campground_Background.png
Dashboard 3: Bubble Gum Reach Calculator
Data file: Bubble Gum Flavors.sav
Image file: BubbleGum-Girl.png
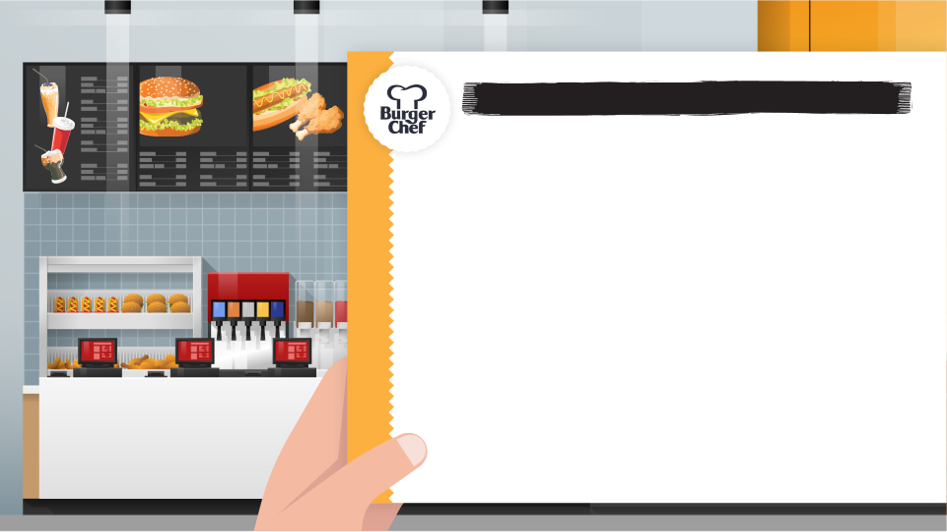
Dashboard 4: Burger Tracker
Initial data file: Restaurant Chains Oct 2017.sav
Data file with 3 more months of data: Restaurant Chains Dec 2017.sav
Title page background image file: Burger-Chef-Title-Page-Background.png
Title and content background image file: Burger-Chef-Title-and-Content-Background.png
