
What is a Crosstab?

Definitions: crosstab vs contingency table Before we dive into all things crosstabs, it’s worth getting our definitions right. A crosstab (short for cross-tabulation) is a table used in statistics to display the relationship between two or more categorical variables. It allows you to examine how different categories or groups of variables intersect and how they […]
Why Crosstabulation Equals Better Survey Analysis

For businesses looking to make the most out of their survey analysis, crosstabulation is a crucial time and money saving tool for both market growth, and growth within the workplace. When crosstabulation is not used to analyze survey data, it’s easy to either get bogged down in rabbit holes of individual responses or only look […]
Learn How to Use Crosstabulation for Data Insights
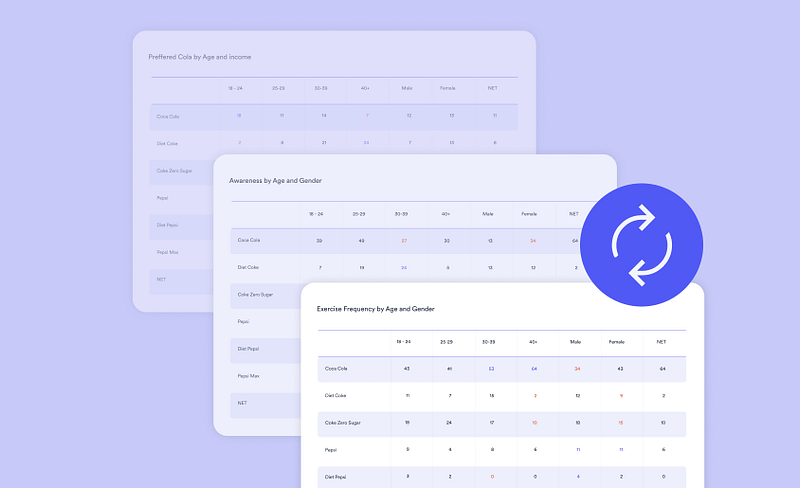
Crosstabulation—it’s the ultimate way to turn the chaos of survey data into valuable insights. Whether you’re a researcher, marketer, or data scientist, mastering crosstabulation (or crosstabs) can transform the way you analyze and present your data. What Is Crosstabulation? Let’s start with some definitions. A tabulation is data in a table (i.e., rows and columns). […]
Crosstabs vs Pivot Tables

What’s a crosstab? What’s a pivot table? Is there a difference? Does it matter? Crosstabs and pivot tables are both effective ways to summarize large datasets. One is better for multi-dimensional analysis, while the other is great for market segmentation. And yes, the difference matters. Knowing when to choose one over the other can greatly […]
Choosing The Best Crosstab Software for Market Research

An Introduction to Crosstab Analysis Software When looking for patterns and trends in survey data, market researchers reach for crosstabs time and time again. Crosstabs (short for crosstabulations) show the correlation between two or more variables in a table format – demonstrating patterns and trends in data and transforming complex datasets into valuable insights. But […]
Crosstab Analysis 101: Make It Work For Your Data
Any market researcher knows how important crosstab analysis is. It’s a quick way to compare the results of one or more variables against another, serving as a fast track to valuable insights. However, effective crosstab analysis is not as simple as putting two variables into a table. That’s why we’ve put together this guide to […]