
What Are Your Chances of Being Hit by a Meteorite?
Have you ever wondered how likely it is that you’ll be hit by a meteorite? Never fear, we’ve analyzed the data and are ready to save the day! Learn where you should stand to avoid space debris! For this analysis, we used a dataset from NASA. It contains over 45,000 meteorites, with details of their […]
Using R to Create Free Online Dashboards
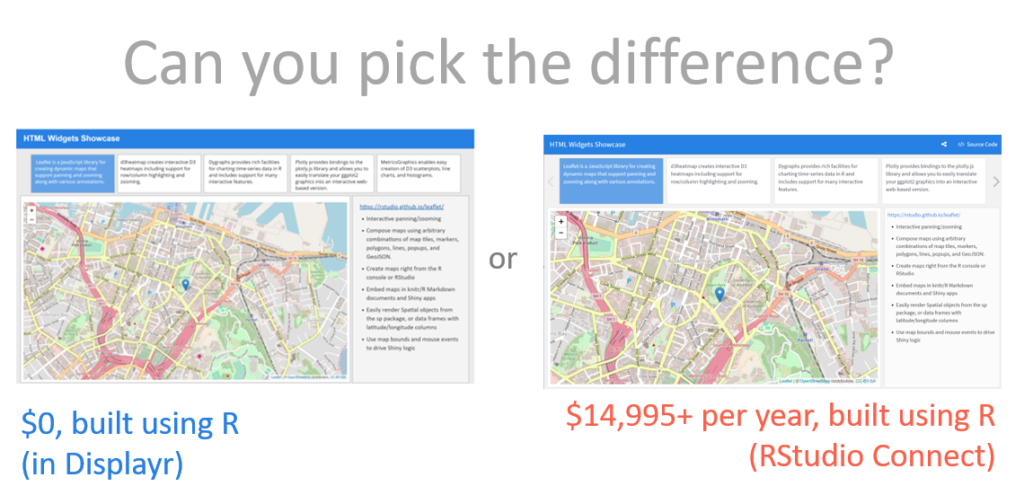
It is now possible to create public dashboards, based on R code, for free! To illustrate how it works, I’ve used the free version of Displayr to create a copy of RStudio Connect’s HTML Widgets Showcase. Getting started The first step is to click this link which will prompt you to sign up. Sign up is free. Then all you […]
How to Create a Simple Dashboard in Displayr
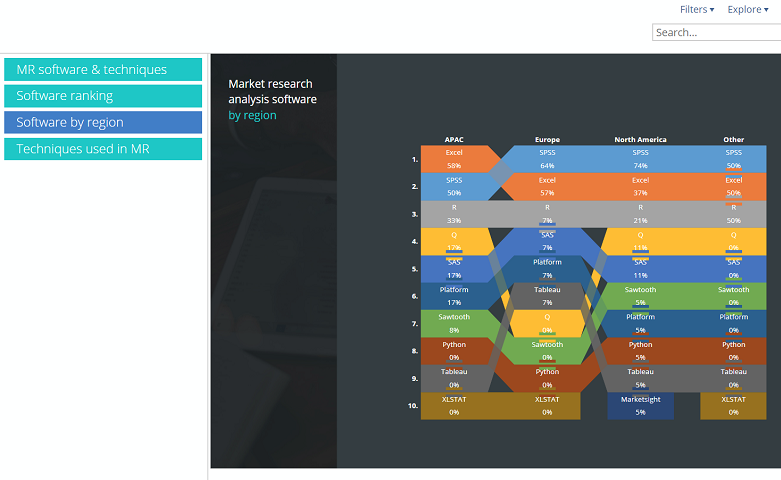
How do you create a simple dashboard that is interactive without using code? This article shows you how to create a simple dashboard in minutes using a worked example in Displayr. You will learn how to import data, create and combine separate charts and visualizations into one dashboard, create and apply filters, and publish online. The […]
Displayr Dashboard Showcase
This post provides examples of different types of Dashboards created in Displayr. For each dashboard you can both view the dashboard in View mode (the mode seen by the end-users), and edit the dashboard in Edit mode, to see how it works. Microsoft KPI Overview: A one-page dashboard showing stock price and Google Trends data […]