We’ve overhauled the technology for visualizations that show a single number. They’re much faster now. The user interface has also been tweaked.
Recap – what’s a single number visualization?
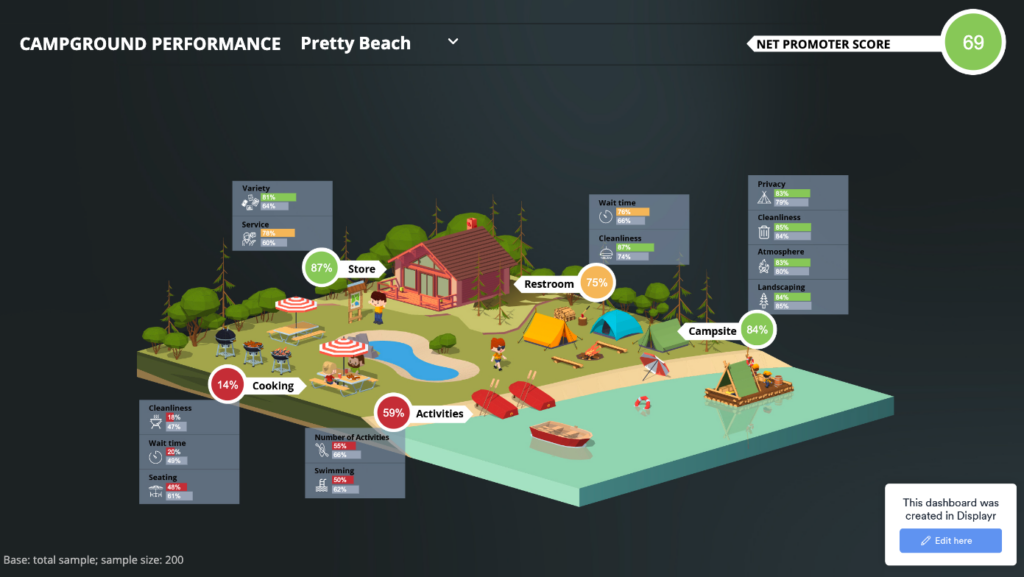
Many dashboards and infographics are collages of images and visualizations. For example, the dashboard below consists of 32 visualizations on top of a background image. Each visualization below shows a single number, either as a bar or a circle. When a visualization contains a single number, we call it a Number Visualization. (Most traditional visualizations show multiple numbers; e.g., a pie chart has a number for each pie segment.)
They’re now faster
The underlying technology we initially used to create the single number visualizations was relatively slow. The more you had on a page, the slower things got. They have now been rebuilt with faster technology.
The user interface has changed
The old user interface was a bit clunky. The new interface is more straightforward and more flexible. For more information see How to Create a Number in a Shape Visualization.
Migrating existing visualizations
Any dashboards you’ve already created will still work, and there is no need to do anything. However, they will be using older technology. If you want to switch to the newer visualizations:
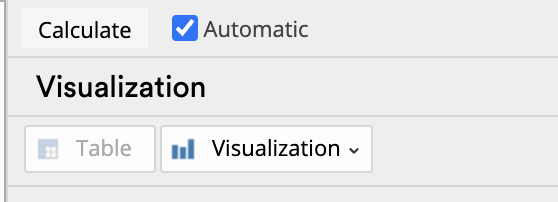
- Select each visualization
- Press the Visualization button in the object inspector.
- Choose your desired visualization in the Number group.