
This webinar shows how you can say goodbye to headaches and hello to the freedom of DIY dashboards with Displayr.
Market research dashboards have had a (deservedly) bad rap for years.
In this webinar you will learn
Here’s a little summary of some of the subjects we cover in this webinar
Most researchers would avoid them because they were over-complicated headaches – an expensive, and painful process masquerading as a high-tech beautiful way of presenting data.
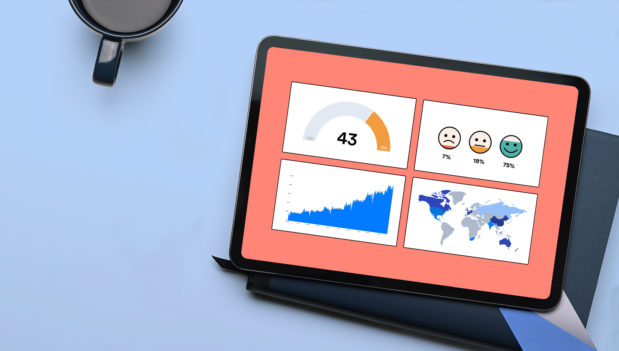
Now you can take the work out of creating dashboards:
- Go from survey data to visualization in seconds
- Easily create filters and other interactive features
- Analyze data and instantly find the story
- Tips for publishing branded dashboards
- Create effortless pictographs, donuts, time series, stream graphs, palm trees, self-sorting charts and more!!
Interactive, online reporting is now a piece of cake for market researchers. Discover how in this short webinar.