


In market research, a Top 2 Box score is a common method for reporting results of categorical scale questions in which the top two responses are combined. One common example of this would be the 5-point satisfaction scale:
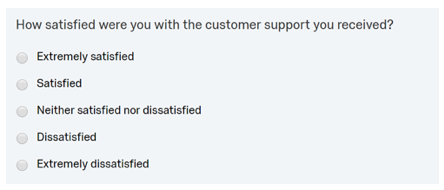
In this case, the first option in the scale (Extremely satisfied) is considered the top box and the percentage of respondents who selected this option is the called the Top Box score. The Top 2 Box score then, is simply the percentage of respondents who selected either the top box (Extremely satisfied) or the second box (Satisfied) response. So, in this example, the Top 2 Box score can be said to be the percentage of respondents in the sample who have expressed some level satisfaction. Another way to state this would be to say that the Top 2 Box score is the NET of the top 2 satisfaction ratings.
Purpose and use
The advantage of using a Top 2 Box score allows researchers to focus on a single metric rather than having to deal with and interpret the response percentages for each individual scale category. Consider the following table which shows the results of a satisfaction ratings for various brands.
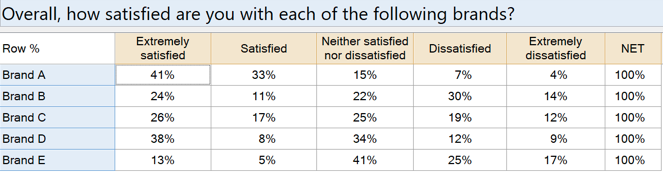
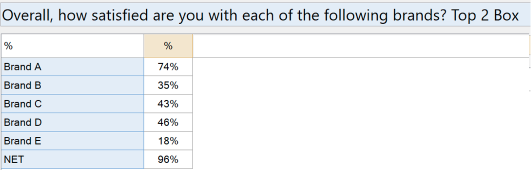
Notice that each individual rating category is displayed in the table. Interpreting these results is challenging for obvious reasons. Combining the Top 2 Box percentages into a single value provides a single metric which makes it much easier to interpret and compare.
Because of the reduced number of figures being displayed, the Top 2 Box approach provides additional flexibility in the ability to crosstab against other variables in a banner, such as respondent demographics.
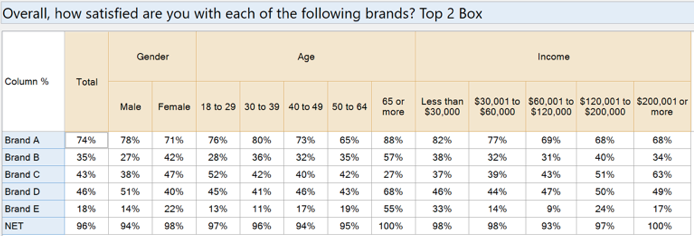
This approach makes it much easier to compare customer satisfaction ratings across sub-groups than it would otherwise be when using the full satisfaction scale.
An alternative measure of overall satisfaction would be to take an average of all values across the entire sample. It is entirely up to the researcher to decide which is the most appropriate method for interpreting the scale question.
While satisfaction scales like to one above are extremely common in market research, this is just one of many ordinal Likert scale questions commonly used in market research. Some examples of these are:
- Agreement scales (how much do you agree or disagree with the following statement)
- Likelihood to recommend (how likely are you the following product or service)
- Importance scales (how important are each of the following features)
- Behavioral frequencies (how often do you engage in the following activities)
These are just a few examples of the different types of scale questions which the Top 2 Box score can be used.
Tutorial: Measure Customer Satisfaction in Displayr
Variations
While top 2 box scores are the most common, researchers may also choose in some cases to use Top 3 Box or even Top 4 Box scores. These types of scores are much more common in larger (7-point or 10-point) scale questions. For example, a researcher using the following 7-point scale may be interested in reporting the Top 3 Box score:
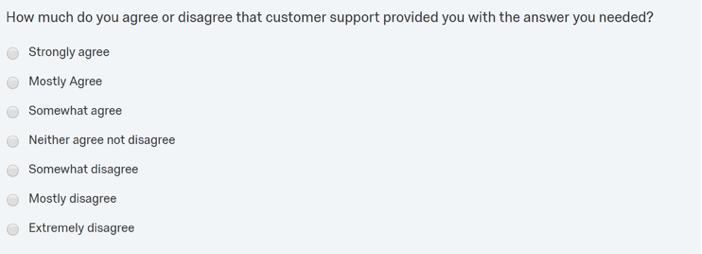
This type of scale allows the researcher to aggregate those who agree with a given statement but also contains enough scale points so that varying degrees of agreement can be analyzed as well.
Similarly, Net Promoter Score (NPS) questions typically utilize a 10-point likelihood to recommend scale question. Top 2 Box respondents are commonly labeled as Promoters in a standard NPS analysis, whereas the Bottom 6 Box respondents are classified as Detractors.
