Driver analysis, which is also known as key driver analysis, importance analysis, and relative importance analysis, quantifies the importance of a series of predictor variables in predicting an outcome variable. Each of the predictors is commonly referred to as a driver. It is used to answer questions such as:
- What is the best way to improve the preference for a brand?
- Should a firm concentrate on reducing the price or improving quality?
- Should a brand focus on being positioned as being cool, or competent?
Outputs from driver analysis
The key output from driver analysis is a measure of the relative importance of each of the predictor variables in predicting the outcome variable. These importance scores are also known as importance weights. Typically, they will either add up to 100% or the R-squared statistic.
Data required for driver analysis
Driver analysis is usually performed using data from surveys, where data has been collected for one or multiple brands. For each of the brands included in the survey, there is typically an overall rating of performance, as well as ratings on performance on various aspects of that overall performance (i.e., the drivers of overall performance).
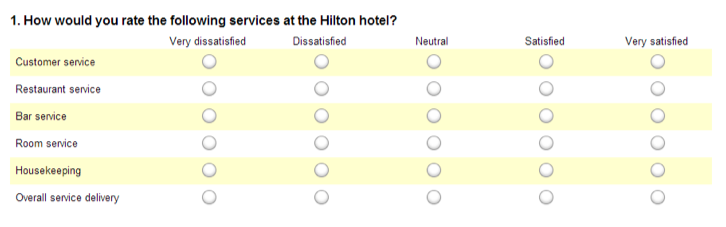
Such data is typically collected from one or more grid questions, such as the example below (“Hilton”). The last row collects data on the overall level of performance. This is an outcome of interest to the Hilton. The other lines measure the Hilton’s performance on various attributes. Each of these attributes is a driver of the outcome of overall service delivery.
How are driver importance scores computed?
There are two technical challenges that need to be resolved when performing driver analysis. One is to ensure that all the predictors are on the same scale and the other is to address correlations between predictors.
If one predictor is on a scale of 0 to 100, and another on a scale of 0 to 1, the first predictor will end up with an importance of 1/100th of the first, all else being equal. This can be resolved by either rescaling the data to make it comparable (e.g., making all predictors have a range of 1 or a standard deviation of 1), or by using statistics that ignore scale, such as correlations, beta scores, Shapley Regression, and Johnson’s Relative Weights.
The more challenging problem with driver analysis is dealing with correlations between predictor variables, which make it hard to obtain reliable conclusions about relative importance. This is addressed by using methods specifically developed for this purpose, such as Shapley Regression and Johnson’s Relative Weights.
Analyzing data for multiple brands
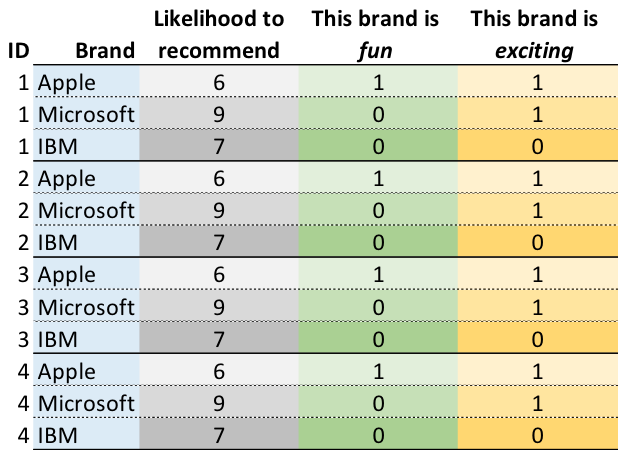
Often a survey will collect data on multiple brands, and the goal of driver analysis is to quantify the average importance of the predictors across all the brands. This is performed in the same way as described above, except that the data needs to first be stacked.
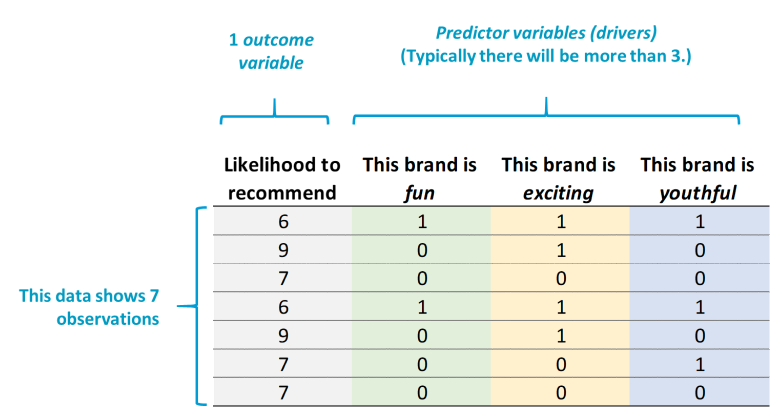
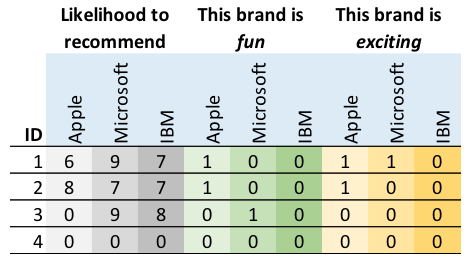
Typically, the data will initially be in a wide format, such as shown below.
Stacking when conducting driver analysis involves rearranging the data, so that it instead has a single outcome variable column, and a single column for each predictor, as shown below. Typically a new data file is created that contains the stacked data.