What is a Dendrogram?
What is a cluster analysis dendrogram?
A dendrogram (or clustering dendrogram) is a diagram that shows the hierarchical relationship between objects. It is most commonly created as an output from hierarchical clustering. Dendrograms are used in machine learning and data science to help visualize clustering.
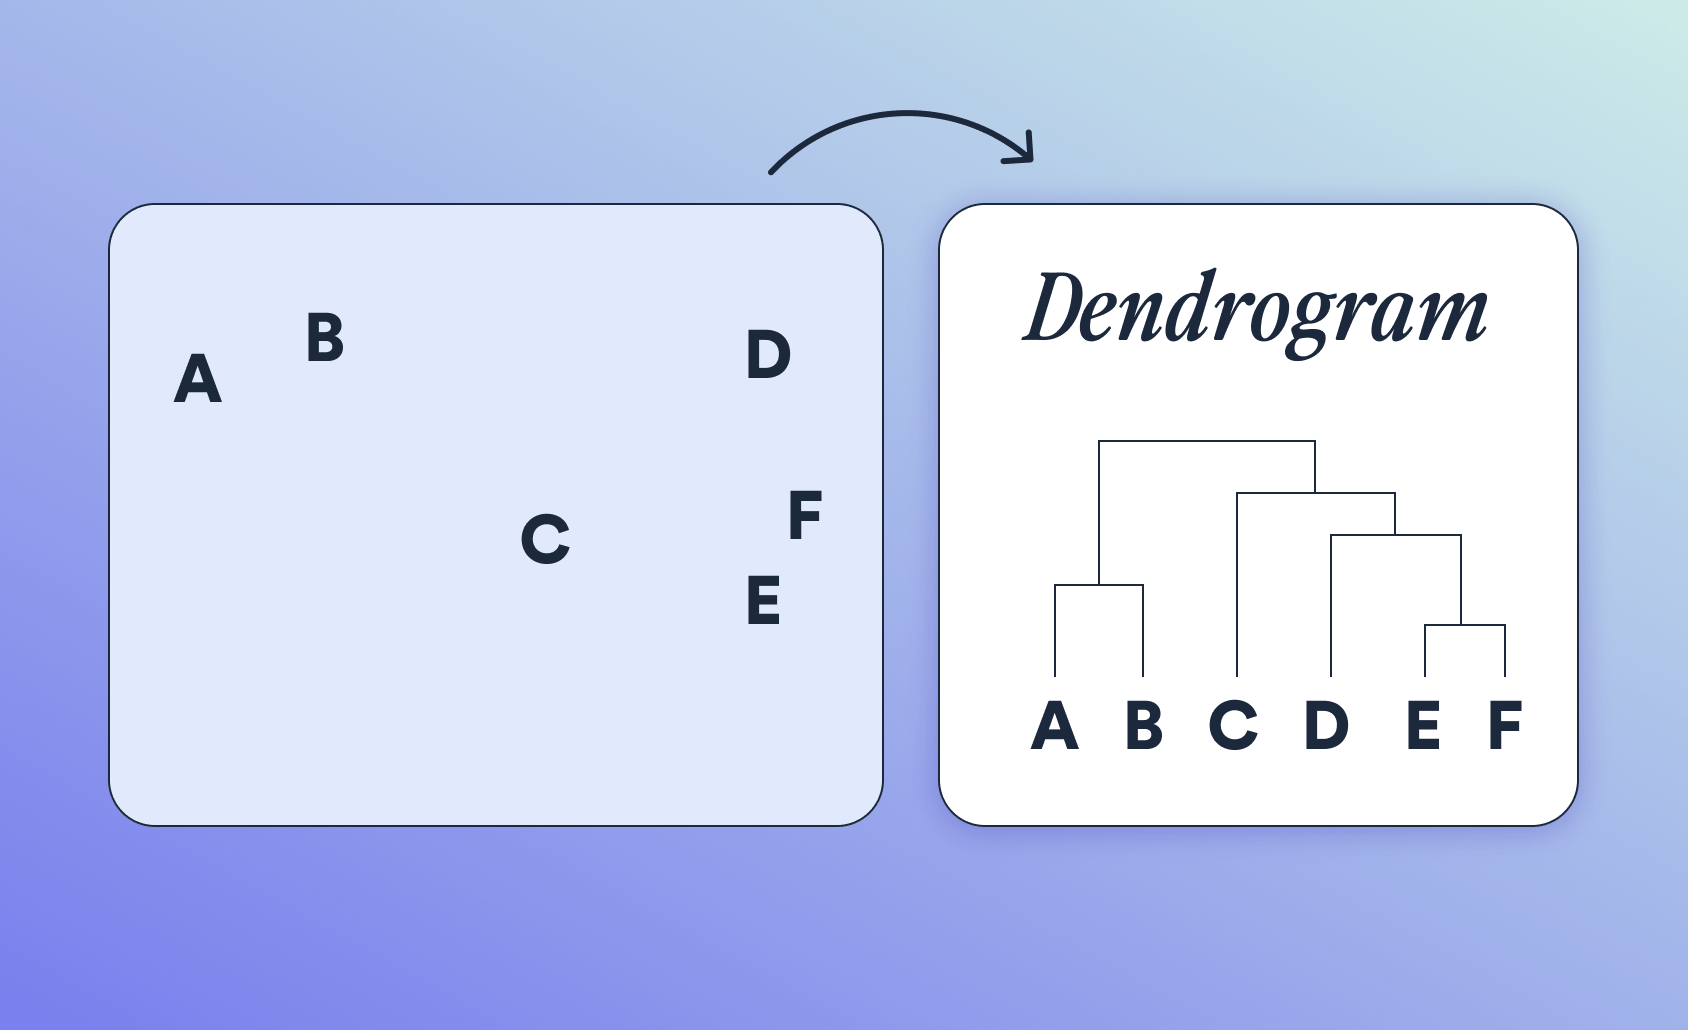
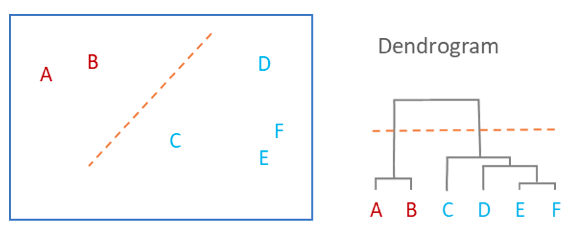
The main use of a dendrogram is to work out the best way to allocate objects to clusters. The dendrogram below shows the hierarchical clustering of six observations shown on the scatterplot to the left. (Dendrogram is often miswritten as dendogram.)
How do you read a dendrogram?
The key to interpreting a dendrogram is to focus on the height at which any two objects are joined together. In the example above, we can see that E and F are most similar, as the height of the link that joins them together is the smallest. The next two most similar objects are A and B.
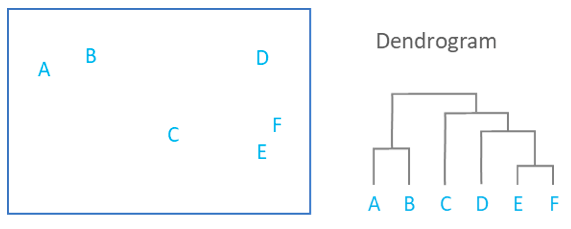
In the dendrogram above, the height of the dendrogram indicates the order in which the clusters were joined. A more informative dendrogram can be created where the heights reflect the distance between the clusters, as shown below. In this case, the dendrogram shows us that the big difference between clusters is between the cluster of A and B versus that of C, D, E, and F.
It is important to appreciate that the dendrogram is a summary of the distance matrix, and, as occurs with most summaries, information is lost. For example, the dendrogram suggests that C and D are much closer to each other than is C to B, but the original data (shown in the scatterplot), shows us that this is not true. To use some jargon, a dendrogram is only accurate when data satisfies the ultrametric tree inequality, and this is unlikely for any real-world data.
The consequence of the information loss is that the dendrograms are most accurate at the bottom, showing which items are very similar.
Allocating observations to clusters
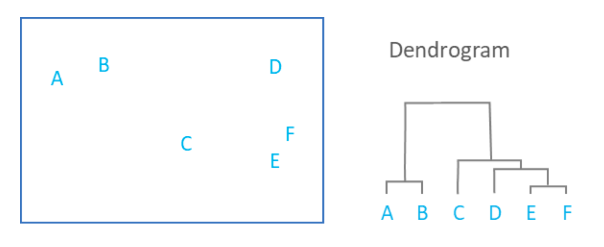
Observations are allocated to clusters by drawing a horizontal line through the dendrogram. Observations that are joined together below the line are in clusters. In the example below, we have two clusters. One cluster combines A and B, and a second cluster combines C, D, E, and F.
Dendrograms don't determine cluster number
A common mistake people make when reading dendrograms is to assume that the shape of the dendrogram gives a clue as to how many clusters exist. In the example above, the (incorrect) interpretation is that the dendrogram shows that there are two clusters, as the distance between the clusters (the vertical segments of the dendrogram) are highest between two and three clusters.
Interpretation of this kind is justified only when the ultrametric tree inequality holds, which, as mentioned above, is very rare. In general, it is a mistake to use dendrograms as a tool for determining the number of clusters in data. Where there is an obviously “correct” number of clusters, this will often be evident in a dendrogram. However, dendrograms often suggest a correct number of clusters when there is no real evidence to support the conclusion.
Dendrogram examples and applications
Dendrograms are more than just theoretical tools—they’re used every day by businesses and market researchers to uncover patterns and make smarter decisions. Some common examples of how dendrograms can be applied in the real world include:
- Customer segmentation: By analyzing purchasing behavior, demographics, or survey responses, researchers can use hierarchical clustering to group customers with similar characteristics and visually display these groupings with a dendrogram.
- Product grouping: A dendrogram can reveal natural groupings among products, making it easier to manage inventory, design bundles, or develop new product lines that fill gaps in the market.
- Brand perception studies: By clustering brands based on attributes from survey data (such as quality, value, or innovation), a dendrogram can illustrate which brands are seen as similar or distinct in the minds of consumers.
- Survey data analysis: When dealing with large-scale surveys, dendrograms help researchers explore patterns in responses. For example, questions or respondents can be clustered based on answer similarity, revealing underlying themes or groups within the data that might not be obvious at first glance.
- Store or location analysis: Retailers can use dendrograms to group stores or locations based on sales performance, customer demographics, or product mix. This can inform regional marketing strategies, optimize supply chains, or identify best practices from top-performing locations.
We hope you're now an expert in dendrograms!
To create your own dendrogram quickly in Displayr as an output of hierarchical cluster analysis, get started here.
Find out more about cluster analysis in Displayr.