


Hierarchical clustering, also known as hierarchical cluster analysis, is an algorithm that groups similar objects into groups called clusters. The endpoint is a set of clusters, where each cluster is distinct from each other cluster, and the objects within each cluster are broadly similar to each other.
Required Data
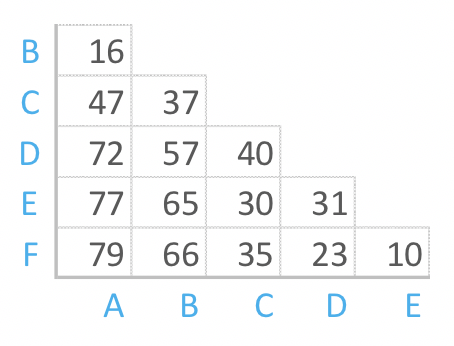
Hierarchical clustering can be performed with either a distance matrix or raw data. When raw data is provided, the software will automatically compute a distance matrix in the background. The distance matrix below shows the distance between six objects.
Create your own hierarchical cluster analysis
How Hierarchical Cluster Analysis Works
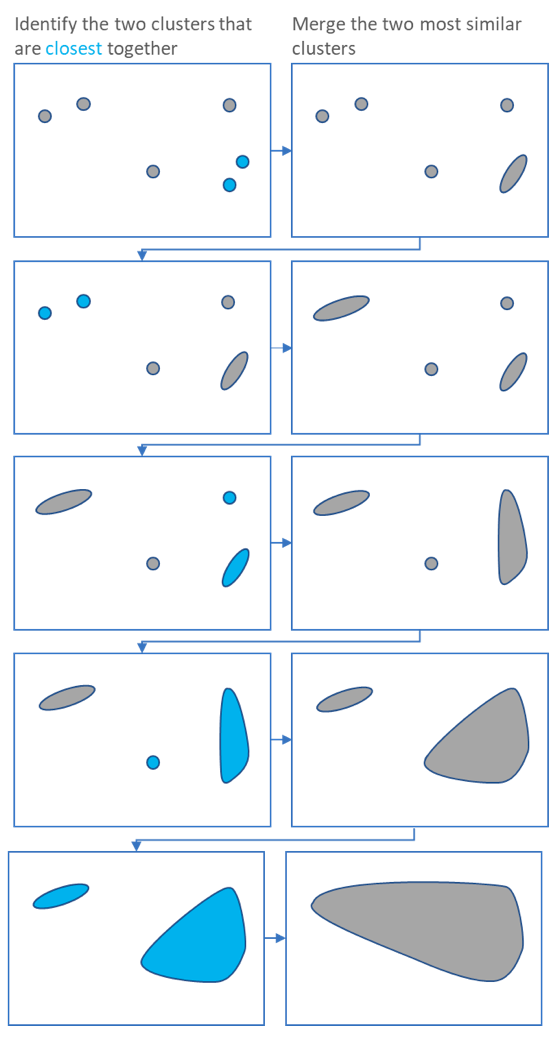
Hierarchical clustering starts by treating each observation as a separate cluster. Then, it repeatedly executes the following two steps: (1) identify the two clusters that are closest together, and (2) merge the two most similar clusters. This iterative process continues until all the clusters are merged together. This is illustrated in the diagrams below.
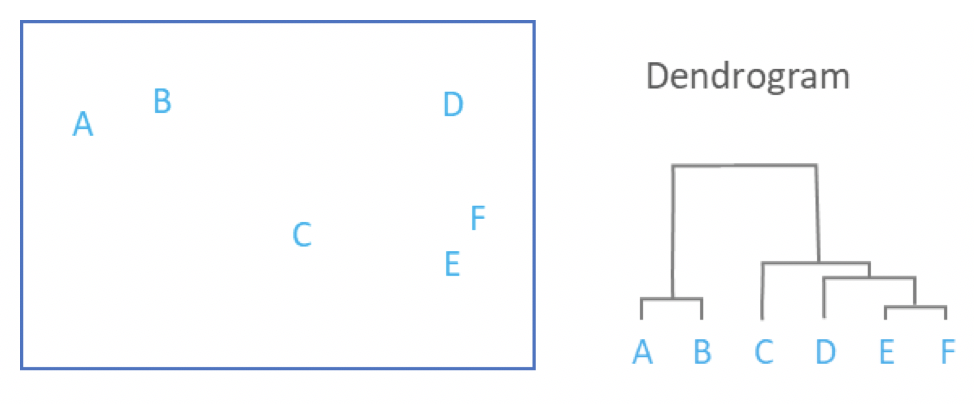
The main output of Hierarchical Clustering is a dendrogram, which shows the hierarchical relationship between the clusters:
Create your own hierarchical cluster analysis
Measures of Distance (Similarity)
In the example above, the distance between two clusters has been computed based on the length of the straight line drawn from one cluster to another. This is commonly referred to as the Euclidean distance. Many other distance metrics have been developed.
The choice of distance metric should be made based on theoretical concerns from the domain of study. That is, a distance metric needs to define similarity in a way that is sensible for the field of study. For example, if clustering crime sites in a city, city block distance may be appropriate. Or, better yet, the time taken to travel between each location. Where there is no theoretical justification for an alternative, the Euclidean should generally be preferred, as it is usually the appropriate measure of distance in the physical world.
Create your own hierarchical cluster analysis
Linkage Criteria
After selecting a distance metric, it is necessary to determine from where distance is computed. For example, it can be computed between the two most similar parts of a cluster (single-linkage), the two least similar bits of a cluster (complete-linkage), the center of the clusters (mean or average-linkage), or some other criterion. Many linkage criteria have been developed.
As with distance metrics, the choice of linkage criteria should be made based on theoretical considerations from the domain of application. A key theoretical issue is what causes variation. For example, in archeology, we expect variation to occur through innovation and natural resources, so working out if two groups of artifacts are similar may make sense based on identifying the most similar members of the cluster.
Where there are no clear theoretical justifications for the choice of linkage criteria, Ward’s method is the sensible default. This method works out which observations to group based on reducing the sum of squared distances of each observation from the average observation in a cluster. This is often appropriate as this concept of distance matches the standard assumptions of how to compute differences between groups in statistics (e.g., ANOVA, MANOVA).
Create your own hierarchical cluster analysis
Agglomerative Vs. Divisive Hierarchical Clustering Algorithms
Hierarchical clustering typically works by sequentially merging similar clusters, as shown above. This is known as agglomerative hierarchical clustering. In theory, it can also be done by initially grouping all the observations into one cluster, and then successively splitting these clusters. This is known as divisive hierarchical clustering. Divisive clustering is rarely done in practice. This is because agglomerative methods are generally more computationally efficient and easier to implement.
Interpreting Hierarchical Cluster Analysis Results
As mentioned above, the main output of hierarchical clustering is a dendrogram. To interpret a dendrogram effectively, focus on the height at which clusters merge. In the example above, E and F are the most similar since they are joined at the lowest height. Similarly, A and B form the next closest pair.
The height of the dendrogram represents the sequence in which clusters are combined. A more detailed dendrogram can be generated by scaling the heights to reflect the actual distances between clusters. As shown below, this approach highlights that the most significant separation occurs between the A-B cluster and the combined group of C, D, E, and F.
Hierarchical Clustering in R and Python
Both R and Python implement hierarchical clustering in a few lines of code. The output in both cases is a dendrogram that you can use to determine the appropriate number of clusters.
In R, use dist() to compute the distance matrix and hclust() to perform the clustering:
hc <- hclust(dist(data))
plot(hc, main = "Hierarchical Clustering Dendrogram", xlab = "", sub = "")
The default linkage method is complete linkage. For most survey and market research data, method = "ward.D2" produces tighter, more interpretable clusters:
hc <- hclust(dist(data), method = "ward.D2")
plot(hc)
In Python, scipy handles both the clustering and the dendrogram plot:
from scipy.cluster.hierarchy import dendrogram, linkage
import matplotlib.pyplot as plt

Z = linkage(data, method='ward')
dendrogram(Z)
plt.title('Hierarchical Clustering Dendrogram')
plt.show()
To cut the dendrogram and assign each observation to a cluster, use fcluster():
from scipy.cluster.hierarchy import fcluster
labels = fcluster(Z, t=3, criterion='maxclust')
Alternative Methods to Hierarchical Clustering
In Displayr, hierarchical cluster analysis treats the variables as the cases, meaning it is used to create segments of products, brands, etc. If your aim is to group similar respondents together, you should consider the following alternatives:
- K-means clustering: Groups data into a specified number (k) of clusters by assigning each point to the nearest cluster center. The algorithm iteratively adjusts the cluster centroids to minimize the total variance within clusters, ensuring that data points within the same cluster are as close as possible to their respective center.
- Latent class analysis: Groups people based both on their similarity to the clusters and the size of the clusters (e.g., if one person is equally close to two clusters, they are assigned to the larger cluster).
You can find more alternative clustering techniques in Displayr’s ultimate guide to cluster analysis.
Real-World Use Case: Customer Segmentation
A real-world application of hierarchical clustering can be found in customer segmentation for marketing. By grouping customers based on purchasing behavior, demographic data, or web browsing patterns, companies can identify distinct segments within their customer base. For example, an e-commerce retailer might use hierarchical clustering to identify high-value customers, frequent shoppers, and price-sensitive consumers. This information can then be used to tailor marketing strategies, optimize product recommendations, and design personalized promotions, ultimately improving customer engagement and boosting sales.
Limitations of Hierarchical Clustering
While hierarchical clustering is a valuable tool, it has some limitations that users should be aware of. One of the key drawbacks is its computational inefficiency, especially with large datasets, as the algorithm requires calculating distances between all pairs of data points, resulting in high time and memory complexity. Additionally, hierarchical clustering is sensitive to the choice of distance metrics and linkage criteria, which can significantly impact the resulting clusters. Finally, it tends to perform poorly when data contains noise or outliers, as these can distort the cluster structure and lead to misleading results.
You can quickly create your own hierarchical cluster analysis in Displayr. Sign up below to get started.
Find out more about cluster analysis in Displayr.