






Displayr vs Qualtrics: which should you use?

Qualtrics is a survey collection platform. Displayr is what you use once your survey data has been collected – crosstabs, significance testing, AI-powered analysis and reports that rebuild each wave. If you need to field studies and manage panels, use Qualtrics. If you have the data and need the analysis and reporting, use Displayr.  

Displayr vs Qualtrics
Displayr vs Qualtrics Illustration
Trusted by 2,900+ research teams worldwide

Weighted crosstabs, open-ends  and reporting in one place

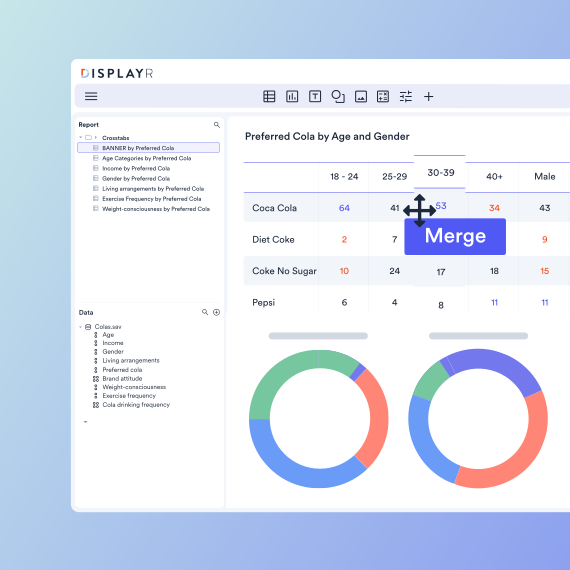
Displayr is an all-in-one survey analysis and reporting platform. Instead of stitching together multiple tools, you get one streamlined workflow. Clean your data, run advanced analysis, build dashboards, and create automated PowerPoint reports – all in the same platform. It’s designed to take the heavy lifting off your plate so you can spend more time on insights and less time wrestling with data.

Single Document Collaboration
Collaborate in real time on a single online document - analyze data, build visualizations, and write reports together without back-and-forth files.
Prompt-Based Analysis
Use custom prompts to analyze data, summarize outputs etc.
Agentic AI Capabilities
Dedicated AI Research Agent that works directly with your data.
AI Data Preparation Agent
Automatically reviews or helps prepare datasets with AI, suggesting or applying transformations based on natural language input (e.g., cleaning, recoding, splitting, flagging issues).
Automated Statistical Testing
Automatically select and run the right tests (e.g. t-tests, ANOVA, regression), then update them with filters or new data.
Full Suite of Built-In Analysis Techniques
Conjoint, MaxDiff, regression, segmentation, factor analysis, TURF, etc.
AI-Powered Text Analytics
AI categorizes open-ends, calculates sentiment, performs entity extraction and more.
Interactive Dashboarding
Create dynamic, interactive dashboards and visual outputs that connect and change with your source data.
AI Code Assistant
AI-generated code and ability to customize (e.g., R or Python).
Automated Reporting
Reusable templates, auto-updating reports and dashboards.
Custom Onboarding & Live Support
How fast new users can get productive (with or without training).
SOC2 Compliance & Security Controls
Regional hosting, user access controls, compliance (SOC2, GDPR, etc.)
Data Connectivity & Large-Scale Importing
Connect directly to Qualtrics, SurveyMonkey, Decipher, etc. via API, or upload large files from cloud storage. Designed to work with complex and high-volume survey data.
Displayr
  • Single Document Collaboration
    Collaborate in real time on a single online document - analyze data, build visualizations, and write reports together without back-and-forth files.
  • Prompt-Based Analysis
    Use custom prompts to analyze data, summarize outputs etc.
  • Agentic AI Capabilities
    Dedicated AI Research Agent that works directly with your data.
  • AI Data Preparation Agent
    Automatically reviews or helps prepare datasets with AI, suggesting or applying transformations based on natural language input (e.g., cleaning, recoding, splitting, flagging issues).
  • Automated Statistical Testing
    Automatically select and run the right tests (e.g. t-tests, ANOVA, regression), then update them with filters or new data.
  • Full Suite of Built-In Analysis Techniques
    Conjoint, MaxDiff, regression, segmentation, factor analysis, TURF, etc.
  • AI-Powered Text Analytics
    AI categorizes open-ends, calculates sentiment, performs entity extraction and more.
  • Interactive Dashboarding
    Create dynamic, interactive dashboards and visual outputs that connect and change with your source data.
  • AI Code Assistant
    AI-generated code and ability to customize (e.g., R or Python).
  • Automated Reporting
    Reusable templates, auto-updating reports and dashboards.
  • Custom Onboarding & Live Support
    How fast new users can get productive (with or without training).
  • SOC2 Compliance & Security Controls
    Regional hosting, user access controls, compliance (SOC2, GDPR, etc.)
  • Data Connectivity & Large-Scale Importing
    Connect directly to Qualtrics, SurveyMonkey, Decipher, etc. via API, or upload large files from cloud storage. Designed to work with complex and high-volume survey data.
Qualtrics Logo
  • Prompt-Based Analysis
    Use custom prompts to analyze data, summarize outputs etc.
  • Automated Statistical Testing
    Automatically select and run the right tests (e.g. t-tests, ANOVA, regression), then update them with filters or new data.
  • Full Suite of Built-In Analysis Techniques
    Conjoint, MaxDiff, regression, segmentation, factor analysis, TURF, etc.
  • AI-Powered Text Analytics
    AI categorizes open-ends, calculates sentiment, performs entity extraction and more.
  • Interactive Dashboarding
    Create dynamic, interactive dashboards and visual outputs that connect and change with your source data.
  • Automated Reporting
    Reusable templates, auto-updating reports and dashboards.
  • Custom Onboarding & Live Support
    How fast new users can get productive (with or without training).
  • SOC2 Compliance & Security Controls
    Regional hosting, user access controls, compliance (SOC2, GDPR, etc.)
  • Data Connectivity & Large-Scale Importing
    Connect directly to Qualtrics, SurveyMonkey, Decipher, etc. via API, or upload large files from cloud storage. Designed to work with complex and high-volume survey data.
Qualtrics is great for collecting survey data, but Displayr is built to actually analyze it - faster, easier, and all in one place.
Displayr customer
Displayr customer

Displayr - Work faster

Work faster

In Qualtrics, many tasks are split across modules, and complex work often needs exporting. With Displayr, everything is built in. That means you can automate stat testing, clean data, analyze open text, run multivariate techniques, and instantly update reports without switching tools. And with real-time collaboration capabilities multiple people can work on the same document at once, so you’re not waiting for handoffs. Hours of work shrink into minutes.

Advanced analyses, no coding

Qualtrics does offer some analytics, but if you want to run advanced techniques like regression, conjoint, MaxDiff, factor analysis, or segmentation, you’ll usually need to export your data to something else. Displayr makes those analyses accessible in just a few clicks – no code required. Everything from the simplest crosstab to the most complex driver analysis can be done in-platform, giving you the freedom to dig deeper without technical roadblocks.

Displayr - Advanced Analysis
Survey analysis - No code

Peace of mind

Displayr’s design makes analysis simpler, cleaner, and less error-prone. Automated workflows eliminate repetitive steps, allowing you to trace and fix issues once, and then watch the updates flow through your entire project automatically. No more endless rework or worrying if your numbers are out of date. With Displayr, you’re always working with live, accurate data.

BI for survey data

Displayr is built specifically for survey data. It supports all the common file formats, lets you combine data sources easily, and gives you hundreds of dynamic visualizations that update instantly. Build dashboards that clients can filter and interact with, share live online reports, or export polished PowerPoints with a single click. Think of it as business intelligence, purpose-built for surveys – fast, flexible, and made for the way researchers actually work.

Displayr - AI data analysis

See why people love Displayr

Your Displayr deep dive starts here

Significance testing: included, not an add-on

In Displayr, significance testing runs on every table by default, with weights applied automatically. In Qualtrics it sits in Stats iQ, which their own documentation calls “an add-on feature not included in the standard Qualtrics license” – and crosstab access is disabled by default too.

Chat with us