
MaxDiff is a research technique for measuring relative preferences. It is typically used in situations where more traditional question types are problematic.
Consider the problem of working out what traits people would like in The President of the United States. Asking people to rate how important each of the following characteristics would not be very useful. We all want a decent/ethical president, but we also want a healthy president. And the President also needs to work well in a crisis.
As most of the traits listed in the table below are critical, there is little likelihood of getting good data by asking people to rate their importance. It is precisely for such a problem that MaxDiff comes to its fore.
Download our free MaxDiff ebook
| Decent/ethical | Good in a crisis | Concerned about global warming | Entertaining |
| Plain-speaking | Experienced in government | Concerned about poverty | Male |
| Healthy | Focuses on minorities | Has served in the military | From a traditional American background |
| Successful in business | Understands economics | Multilingual | Christian |
Create your own MaxDiff Design
MaxDiff consists of four stages:
- Creating a list of alternatives.
- Creating an experimental design.
- Collecting the data.
- Analysis.
1. Creating a list of alternatives to be evaluated
The first stage in a MaxDiff study is working out the alternatives to be compared. If comparing brands, this is usually straightforward. In a recent study where I was interested in the relative preference for Google and Apple, I used the following list of brands: Apple, Google, Samsung, Sony, Microsoft, Intel, Dell, Nokia, IBM, and Yahoo.
When conducting studies looking at attributes, many of the typical challenges with questionnaire wording come into play. In another recent study where I was interested in what people wanted from an American President, I used the list of personal characteristics that are shown in the table above.
Common mistakes
There are two big mistakes that people make when working out which alternatives to include in a MaxDiff study:
- Having too many alternatives. The more alternatives, the worse the quality of the resulting data. With more alternatives, you have only two choices. You can ask more questions, which increases fatigue and reduces the quality of the data. Or, you can collect less data on each alternative, which reduces the reliability of the data. The damage of adding alternatives grows the more alternatives that you have (e.g., the degradation of quality from having 14 versus 13 alternatives is greater than that of having 11 versus 10).
- Vague wording. If you ask people about "price" in a study looking at the preference for product attributes, your resulting data will be pretty meaningless. For some people, "price" will just mean not too expensive, while others will interpret it as a deep discount. It is better to nominate a specific price point or range, such as "Price of $100". Similarly, if you are evaluating Gender as an attribute, it is better to use Male (or Female). Otherwise, if the results show that Gender is important, you will not know which gender was appealing.
Create your own MaxDiff Design
2. The experimental design
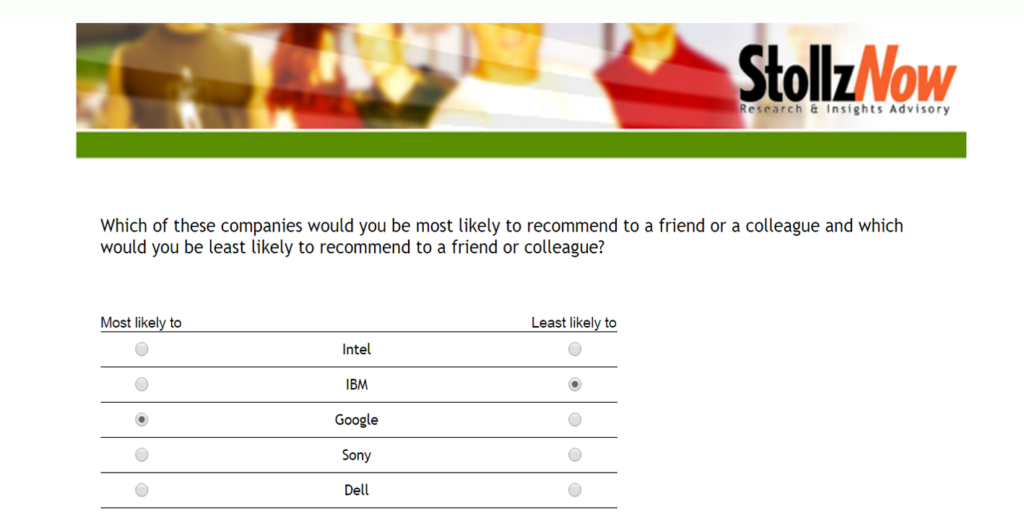
MaxDiff involves a series of questions - typically, six or more. Each of the questions has the same basic structure, as shown below, and each question shows the respondent a subset of the list of alternatives. I usually show five alternatives. People are asked to indicate which option they prefer the most, and which they prefer the least.
People complete multiple such questions. Each is identical in structure but shows a different list of alternatives. The experimental design is the term for the instructions that dictate which alternatives to show in each question. See How to create a MaxDiff experimental design in Displayr for more information about how to create an experimental design.

3. Collecting the data
This is an easy step. You need a survey platform that supports MaxDiff style questions. And, you need to collect some other profiling data (e.g., age, gender, etc.).
Create your own MaxDiff Design
4. MaxDiff Analysis and Reporting
The end-point of MaxDiff is typically one or more of:
- The preference shares of the alternatives. Where the alternatives represent attributes of some kind, such as characteristics desired in the American President, the preference shares are more commonly referred to as relative importance scores (but, they have lots of other names).
- Segments, where each segment exhibits a different pattern of preferences.
- Profiling of preference shares by other data (e.g., demographics, attitudes).
The preference shares for the technology brands are shown below. The data comes from a study conducted in Australia in April 2017. I will provide more detail about the analysis of MaxDiff in forthcoming blog posts.
Also, check out 11 Tips for DIY MaxDiff, or run your own analysis in Displayr!


