

Having collected your customer satisfaction data, it’s time to do some analysis. Here I’ve outlined four common and simple methods of analyzing your customer satisfaction score.
Depending on the structure of your customer feedback survey question, the data will usually come through on a numeric scale. The variation may be in the endpoints, e.g. if you’ve used a 7-point or 10-point scale. Regardless of this, the basic methods of analysis are the same.
Frequencies
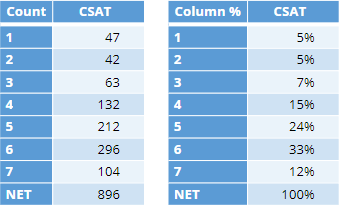
The easiest way to look at your customer satisfaction data is to look at the frequencies for each scale point. In the example below, I have created a table using customer satisfaction data on a scale of 1 to 7. The first table shows the number of respondents to the survey that selected each scale point. It’s easy to see here that a majority of people selected scale points at 4 or above. However, turning this into percentages gives a much clearer understanding of the differences between these groups.
Top and bottom boxes
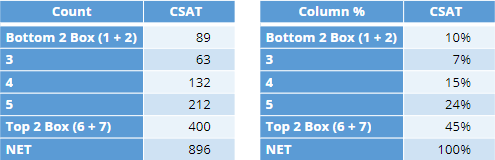
A common method of simplifying the scale is to look at the frequencies of individuals who selected either one of the top or bottom two scale points. In our example here, that would be those respondents that selected 1 or 2 for the bottom “box”, and 6 or 7 for the top “box”. At its simplest, you sum up the number of cases in each of the two sets of scale points, and present them together:
This method can help rid your analysis of bias introduced by respondents who never select the top scale point because “…there’s always room for improvement”.
Top 2 box score
This method is similar to the “top and bottom boxes” approach we just discussed, but instead of examining both ends of the response spectrum, we just consider the top two boxes. The satisfaction score is calculated as a percentage, so the Top 2 Box score for our example data set is 45%.
Average
You are, of course, not limited to frequencies. An average may help you get an idea of the overall customer satisfaction that your respondents are experiencing. This will come out as a single number and should be assessed against the maximum scale point.
![]()
In the example data here, the average comes out at 4.9 out of 7. That’s an OK result, but clearly there may be room to improve the satisfaction among these respondents.
Tutorial: Measure Customer Satisfaction in Displayr
Other methods
It may also be interesting to look at the median and mode of the data. The median will tell you – assuming that your responses to the customer satisfaction are arranged in ascending order – which value falls in the exact middle of your sample. The example data here has an even number of cases (n=896) and so the middle falls between two cases. To get the median for these two cases, we simply take the mean. Here, both cases are 5 and so the mean will also be 5, which then becomes the median.
The mode is simply the scale point with the highest frequency, i.e. the scale point that has been selected the most. We can tell that already from the frequency tables we made earlier: it’s 6.
