


It can often be difficult and time-consuming to organize raw text data into meaningful insights. Manually coding even a single text question can take several hours, even with relatively small sample sizes. Displayr has built-in text categorization tools designed to help you quickly categorize your text data to help easily find valuable insights. One of these tools is the automatic categorization of text data into a list of items.
The example below uses text data from a survey about Tom Cruise. An open-ended question asked respondents, “What don’t you like about Tom Cruise?” which yielded a wide range of responses. Use the automatic categorization tools in Displayr to generate a list of items to see what main themes are of concern to the survey respondents.
Ready to analyze your text?
Start a free trial of Displayr.
Automatic Categorization of Text Data into a List of Items
Start by first importing your data containing the text variable you want to categorize into Displayr (see here for more information on importing). With the data loaded into Displayr, you’re now ready to run the categorization analysis:
- Go to Insert > Text Analysis (Analysis group) > Automatic Categorization > List of Items.
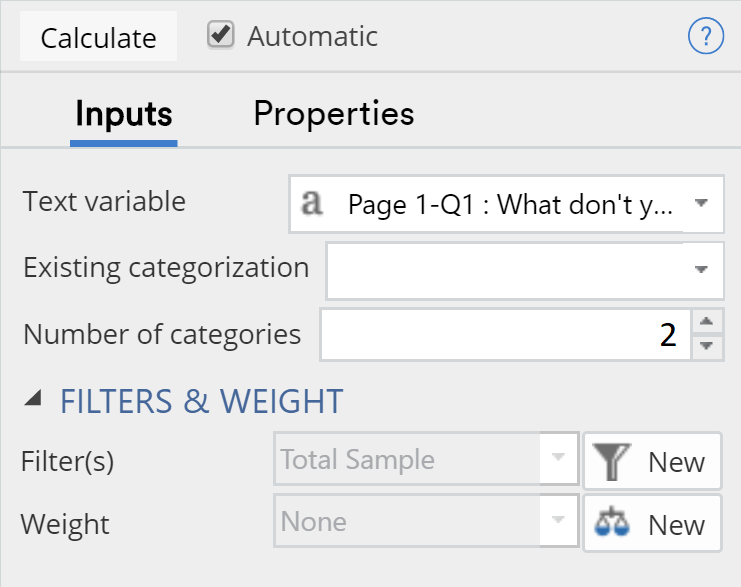
- In the object inspector (the section that opens on the right of the screen), under Inputs > Text variable(s) select the variable that contains the text you want to analyze.
- Change the Inputs > Minimum category size to the number of categories you would like to classify the data into. For this example, we’ll set the number of categories to 2. This means that Displayr will only show categories that contain at least 2 responses.
 4. The output will calculate automatically:
Interpreting the Output
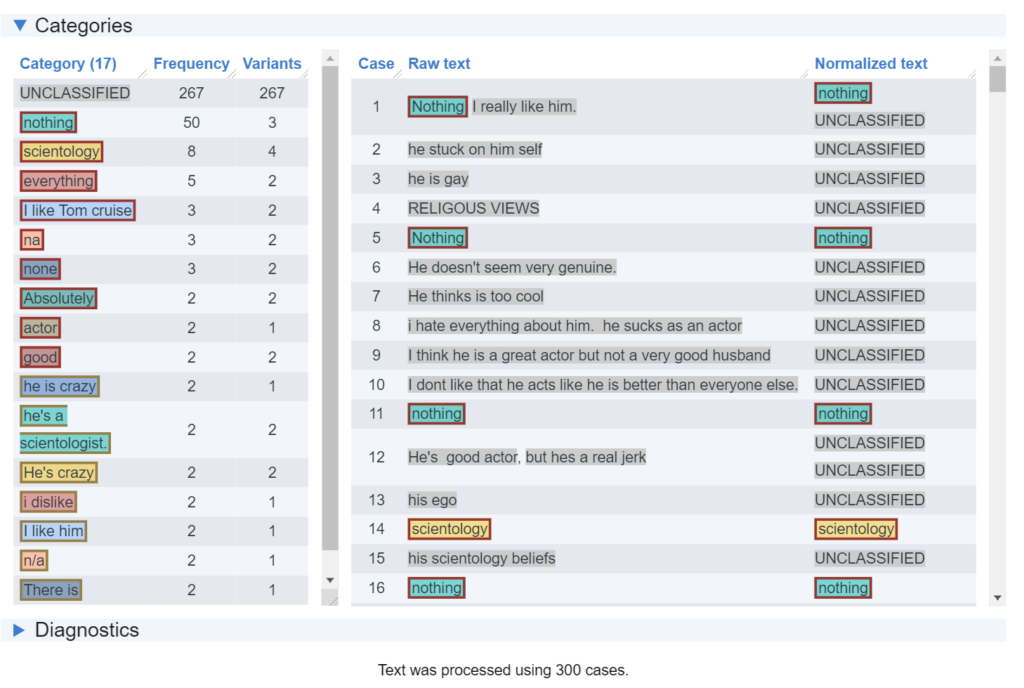
The left side of the output lists the automatically generated categories. The number of individual responses that are put into each category are displayed in the frequency column. The variants indicate how many different specific variations of responses there are in each category. The right side of the output shows the raw (original) text and the normalized or categorized text. The normalized text is the “cleaned” text. In other words, this is the text after spell checking, stemming, word removals and other cleaning functions are performed.
The colored boxes around the word categories are randomly assigned to each category. The only purpose of this is to give specific words a unique style and make them easier to identify. There is no further meaning to this. If “Scientologist” is in a blue box, then all occurrences of “Scientologist” will be in a blue box. This makes it easier to recognize common categories.
How to Save the Categories to your Data Set
You can save the created categories to your data set as a new variable, which can then be used in other analyses. Make sure that the output above is selected on the Page and then go to Insert > Text Analysis > Advanced > Save Variable(s) > Categories. A new multi-select variable is added to your Data Set tree below your original text variable. You can now use this like any of the other variables in your data to create tables, crosstabs, charts, and visualizations.
Keep analyzing
With Displayr’s AI-powered text analysis tool, categorizing text is just the beginning. Once text has been categorized it can easily be integrated into your report or used to update an existing report with new data.
Want to see it yourself? Start a free trial.