





The ultimate toolkit for brand analysis and reporting – market maps, driver analysis, and live, auto-updating reports in one user-friendly app. AI does the repetitive work: coding open-ended brand associations, updating commentary when new data lands, and flagging significant movements – with every AI-generated number traceable back to the data and method behind it.
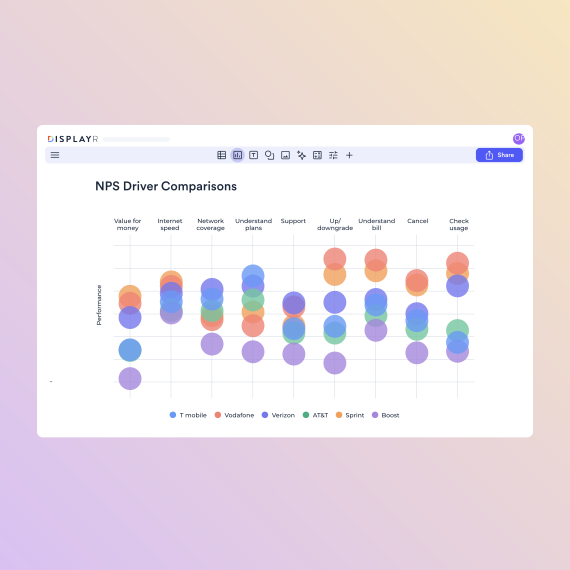
From brand health grids to conversion ratios to interactive brand maps and driver analysis, Displayr makes it easy to do sophisticated analysis using any brand-related data source. Create market maps in a couple of clicks or easily run a best-in-class driver analysis (with Shapley Regression, Johnson’s relative weights, quad maps), or just stay ahead of the game with fully automated brand health tables, with automatic conversion ratios.
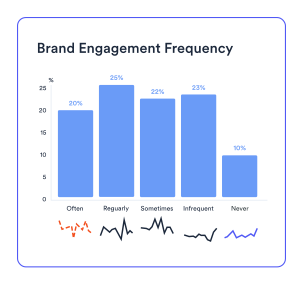
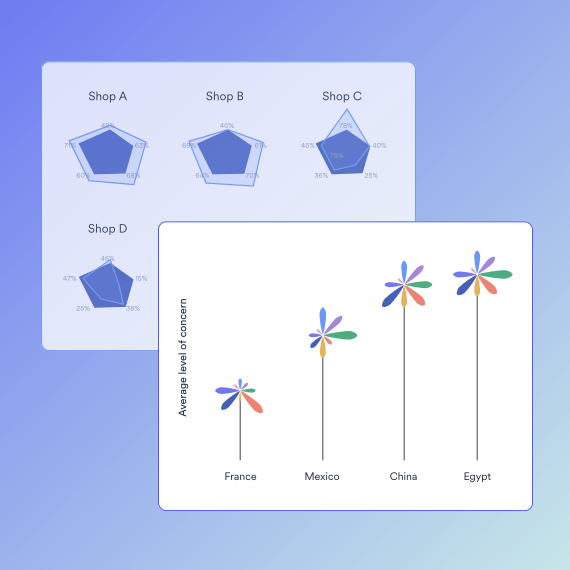
With palm trees and small multiples for comparing brand positioning, or pyramid charts for showing brand conversions and ratios, to interactive reports with drill-downs and hyperlinks, Displayr makes it fast and easy to visualize brand analysis.
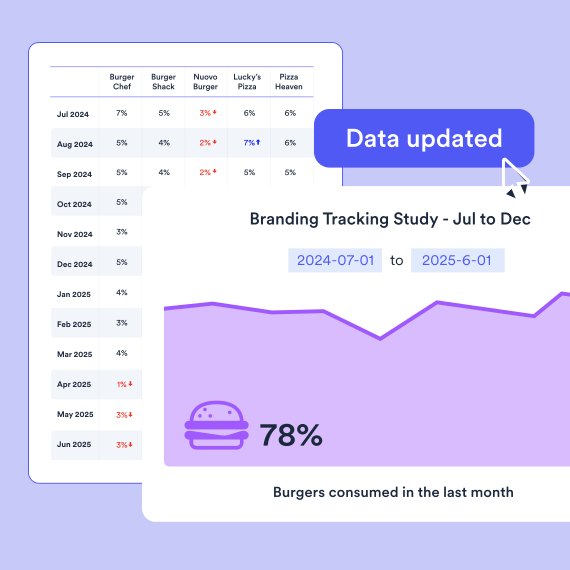
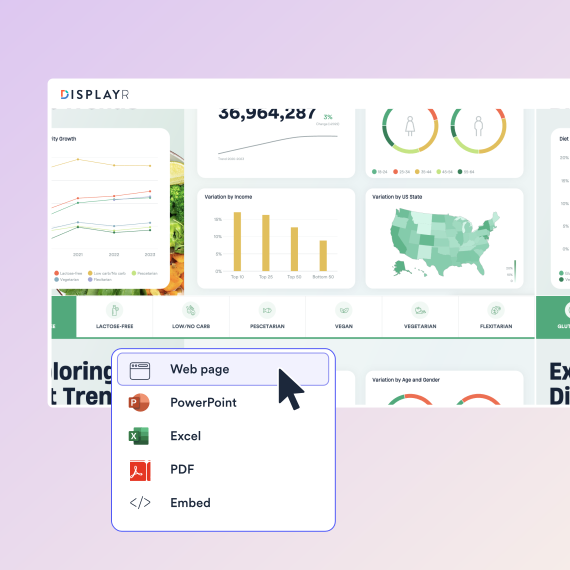
Easily create interactive online reports or PowerPoint reports that are connected to your data. So that when the underlying data changes or updates, every chart, table, text box, conversion ratio, analysis, and visualization updates automatically. No code needed.
Displayr is not just a brand analytics platform; it excels in every aspect including visualization, trend analysis, crosstabs, advanced analytics, dashboards, PowerPoint reporting, data apps, and more. Unlike other brand analytics tools, once you have your brand data, you can seamlessly integrate it into your reports and even update everything automatically with new insights. From one-off brand studies to always-on brand health tracking software workflows – awareness, consideration, and usage tracked wave over wave.
Supercharge brand insights using Displayr’s Research Agent – an AI market research tool that helps you automate brand analytics. Whether you’re tracking brand health, awareness, or loyalty, it automatically runs crosstabs, auto-generates charts, and writes strategic summaries – so you can focus on strategic implications for brand growth. And every AI-generated table or summary traces back to your data and method, so the numbers you take to a brand team are numbers you can defend.

President – Americas, MDI

SQL, databases, Excel, CSV, text, SPSS, survey platforms, APIs, integrations, & more.
Summary tables, crosstabs, pivot tables, regression, text analysis, segmentation, machine learning, & more.
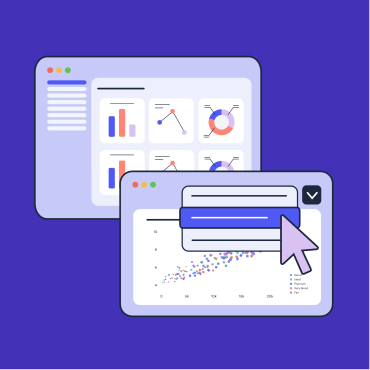
Data visualization, interactive data apps, dashboards, presentations, PowerPoint, Excel, PDF, web pages, & more.

Displayr’s Research Agents integrate AI across your full workflow, from data cleaning to analysis to reporting.
Displayr helps Mobile Digital Insights save 75% on analysis time
Performing brand analysis requires you to compile a variety of different data sources to get a clearer understanding of your brand’s perception in the market. Some common data sources include:
To help maximize the effectiveness of your brand analytics efforts, Displayr has identified five key data analysis frameworks for building a strong brand strategy. Those are:
Combining these frameworks with a best-in-class brand analytics software tool like Displayr will help you see how your brand is performing over time.
Brand analytics usually involves multiple data streams to gauge an understanding. Some of the most important tools to consider are:
Brand analysis tools focus on understanding brand position — market maps, driver analysis, funnels — from any study. Brand tracking software emphasizes monitoring movement wave over wave. Displayr does both in one platform; for a comparison of dedicated trackers, see our guide to brand tracking software tools.