Our mission at Displayr is to make it easy for people to find and tell stories with data.

This does not mean however that you can only do simple analysis steps – for the creative or advanced analyst, Displayr allows you to literally calculate anything.

Gone are the days of having separate workings in other apps, like Excel. Calculations built in Displayr can be referenced anywhere, are easily traceable to the source (no one will ever have to “work it out”), and will update whenever the data changes e.g., applying a filter, adjusting the weight, or adding a new wave of tracking data.

This can save you a lot of time. It's also great for quality control - no need to cut and paste between applications and risk making a mistake. And what’s more, applying calculations in Displayr is both intellectually stimulating and rewarding!

Built-in Calculations

In addition to creating tables and common advanced analysis functions (like clustering, correspondence mapping), Displayr has built-in operations to create simple calculations from variables or tables.


calc menu


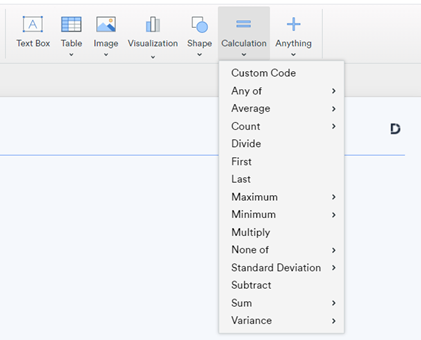
You can read more about these functions here.

Built In Calculations


Create your own custom code

You can however go a lot further with custom code.  Point-and-click functionality allows you to select the specific inputs you need.  This can refer to:

  • variables
  • specific table cells,
  • entire rows or columns and ranges.


calcs on tables


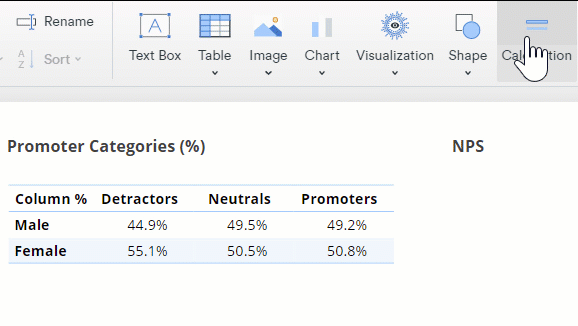
See how easy it is to create your own custom code here.

Calculate Anything


Bespoke analysis functions

Displays allows you to perform the types of functions that people ordinarily do in Excel (e.g. Sum, Average, Count, etc.)

formulas in calculations


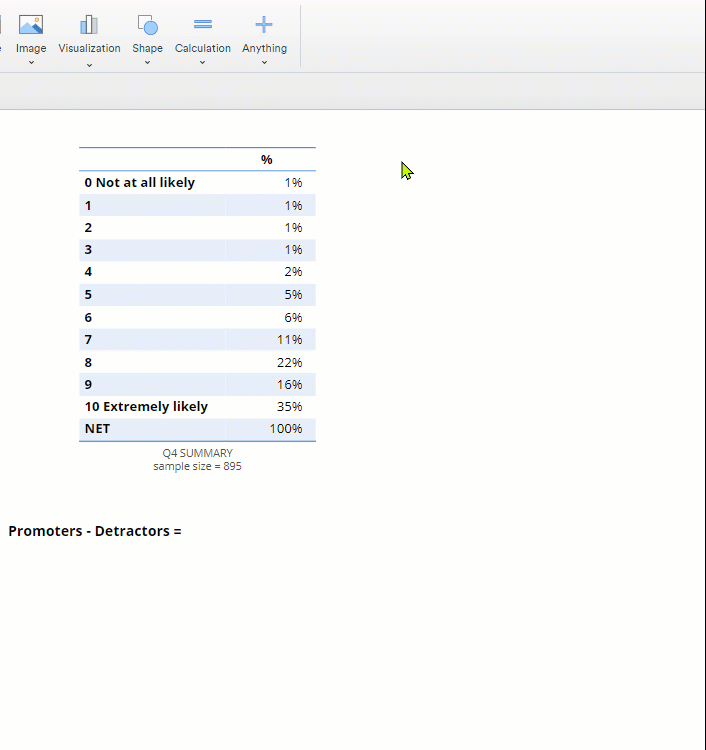
There are a range of examples here

Bespoke Analyses


Calculate Anything In Displayr!

Next time you find yourself in problem-solving mode with your data, find the solution with Displayr's suite of calculation functions.