






Displayr AI is your new research assistant. Whether it’s tidying labels, analyzing open-ends, or summarizing data – let the AI do the heavy lifting and go from raw data to insights fast.
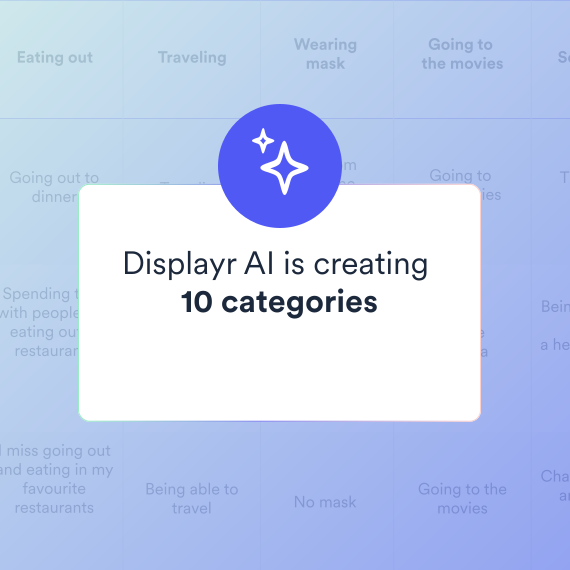
Displayr AI can read through all your open-ended responses and automatically identify key themes. It’s like old-school verbatim coding—only smarter. Instantly group related ideas, fine-tune themes as needed, and get a head start on your analysis.
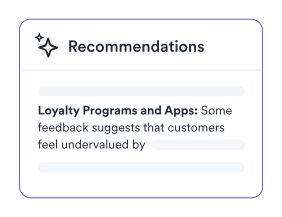
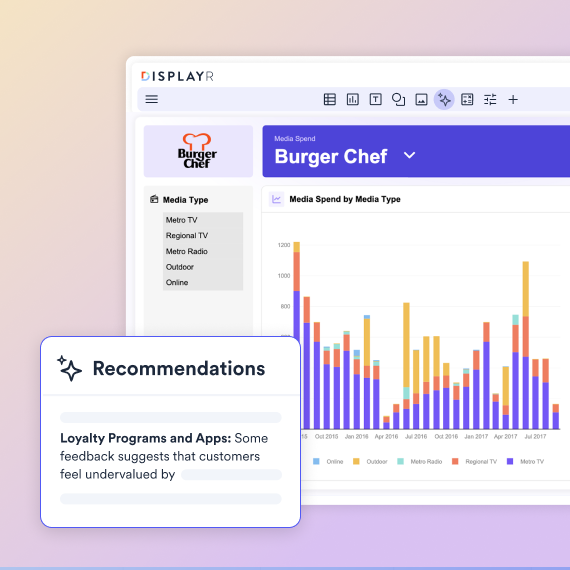
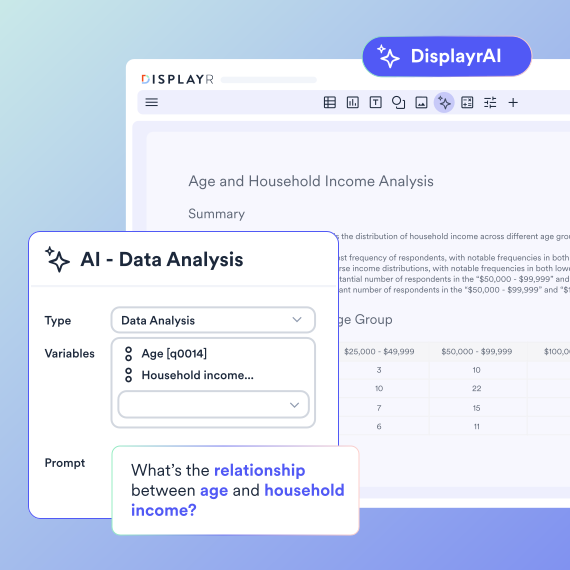
Displayr AI doesn’t stop at text analysis. Use it to summarize your data tables, charts, and even entire reports. It can also generate strategic recommendations based on your findings – ideal for presentations or guiding client discussions.
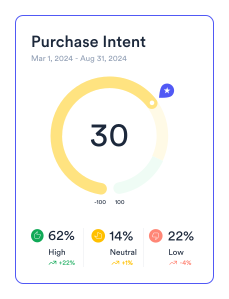
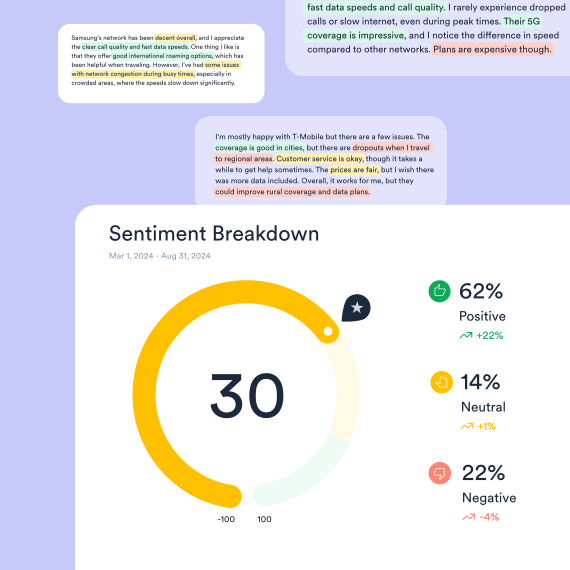
Use AI to detect sentiment, brand affinity, purchase intent, or any other signal in your text. Whether you’re analyzing customer satisfaction data or examining brand perceptions, Displayr AI can extract the emotions and intentions that truly matter.
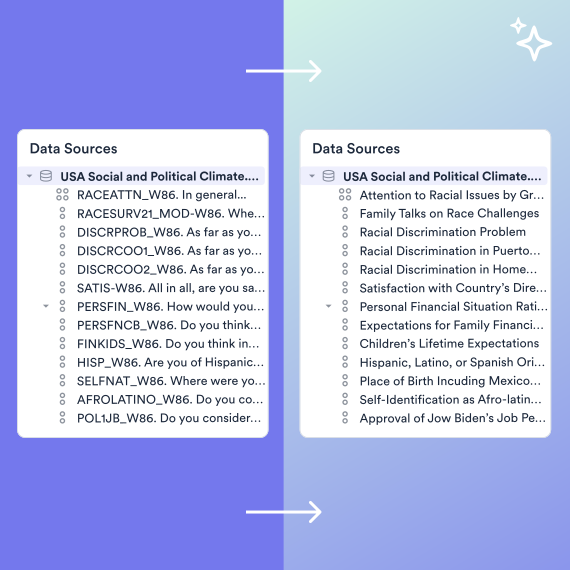
Displayr AI can automatically clean up confusing or overly long variable names, transforming them into clear and meaningful labels. You’ll get a cleaner dataset and reports that make more sense to everyone. And of course, you can still make manual edits when needed.
Want full control? Write your own custom prompts and significantly enhance the quality. Prompt engineering in Displayr gives you the flexibility to instruct the AI to solve your specific text analysis problems – exactly the way you want.
With Displayr’s Research Agent, you can go from raw data to client-ready reports in minutes. The agent analyzes your data, builds charts and dashboards, summarizes key findings, writes strategic recommendations, and then makes it easy to export everything to PowerPoint.

Insights Professional

AI translation and analysis support any language, with native-level accuracy for global insights.
Use AI to write accurate, context-aware R code directly in the Code Editor—seamlessly integrated into your workflow.
Get rid of garbage without the hassle with the automatic identification of low-quality responses.
Built-in summarize, custom calculations, and AI-generated custom variables tools.
Create a customized AI calculation once, then save it as a template for easy reuse.
Create interactive dashboards or export to PowerPoint with drag-and-drop reporting.
Dedicated 24/6 regional support, expert-led training, AI-chatbot, help centre, on-going reviews, certification.
SOC 2 Type 2 certified, regional data hosting, SSO and MFA, end-to-end encryption, dedicated security team.
SQL, databases, Excel, CSV, text, SPSS, survey platforms, APIs, integrations, & more.

Summary tables, crosstabs, pivot tables, regression, text analysis, segmentation, machine learning, & more.

Data visualization, interactive data apps, dashboards, presentations, PowerPoint, Excel, PDF, web pages, & more.

Displayr’s Research Agents integrate AI across your full workflow, from data cleaning to analysis to reporting.
Displayr helps AFJ Consulting cut reporting and analysis time by 25%
Displayr’s AI runs on a statistical engine, not a language model alone. When it codes an open-end, drafts a summary, or flags a movement, the underlying numbers come from real crosstabs, significance tests, and weights — not from a model’s impression of your data. That distinction is why every AI-generated figure traces back to the table, test, and weighting behind it, and why you can hand the working to a client who questions it.
Yes. Displayr AI automatically identifies themes, categorizes responses, and generates intuitive labels. You can collaborate with the AI or let it handle classification end-to-end – making text analysis faster and more consistent.
Yes. Displayr AI supports instant translation across languages, even during theme creation and classification – ideal for working with international or multilingual survey data.
Absolutely. You can build custom AI features, connect your own data, or write your own prompts. Displayr AI adapts to your specific needs—whether you’re transforming data or building tailored reporting workflows.
It depends entirely on whether the AI can show its working. Displayr’s AI produces analysis from actual statistical output – crosstabs, significance tests, weights – so every number traces back to the data and method that produced it. If an AI tool can’t tell you where a figure came from, you can’t defend it to a stakeholder, and you shouldn’t put it in a report.
The statistics are exact, because they’re computed by a statistical engine rather than generated by a language model. AI handles the parts where judgment scales badly – coding open-ends into themes, drafting commentary, flagging significant movements – and the numbers underneath come from the same tests you’d run manually. Accuracy questions with AI are usually really traceability questions: ask any vendor to show you where a number came from
Displayr is SOC 2 Type 2 certified, with end-to-end encryption, regional data hosting, SSO and MFA, and a dedicated security team. Full details are in our Trust Center.
You can find the most up-to-date information on Displayr’s use of AI models here: FAQs about using AI in Displayr.
Yes – Displayr AI can be enabled or disabled at account level or per folder, so it stays off for clients whose contracts prohibit it. More information: Opting in and out of Displayr AI.