A Simple Dashboard

A simple interactive dashboard can be created in seconds by using a cool visualization from Displayr's visualization menu. Once you get your data into Displayr (import, copy, or type your numbers in), it is as easy as going to the Insert and clicking the Visualization button.

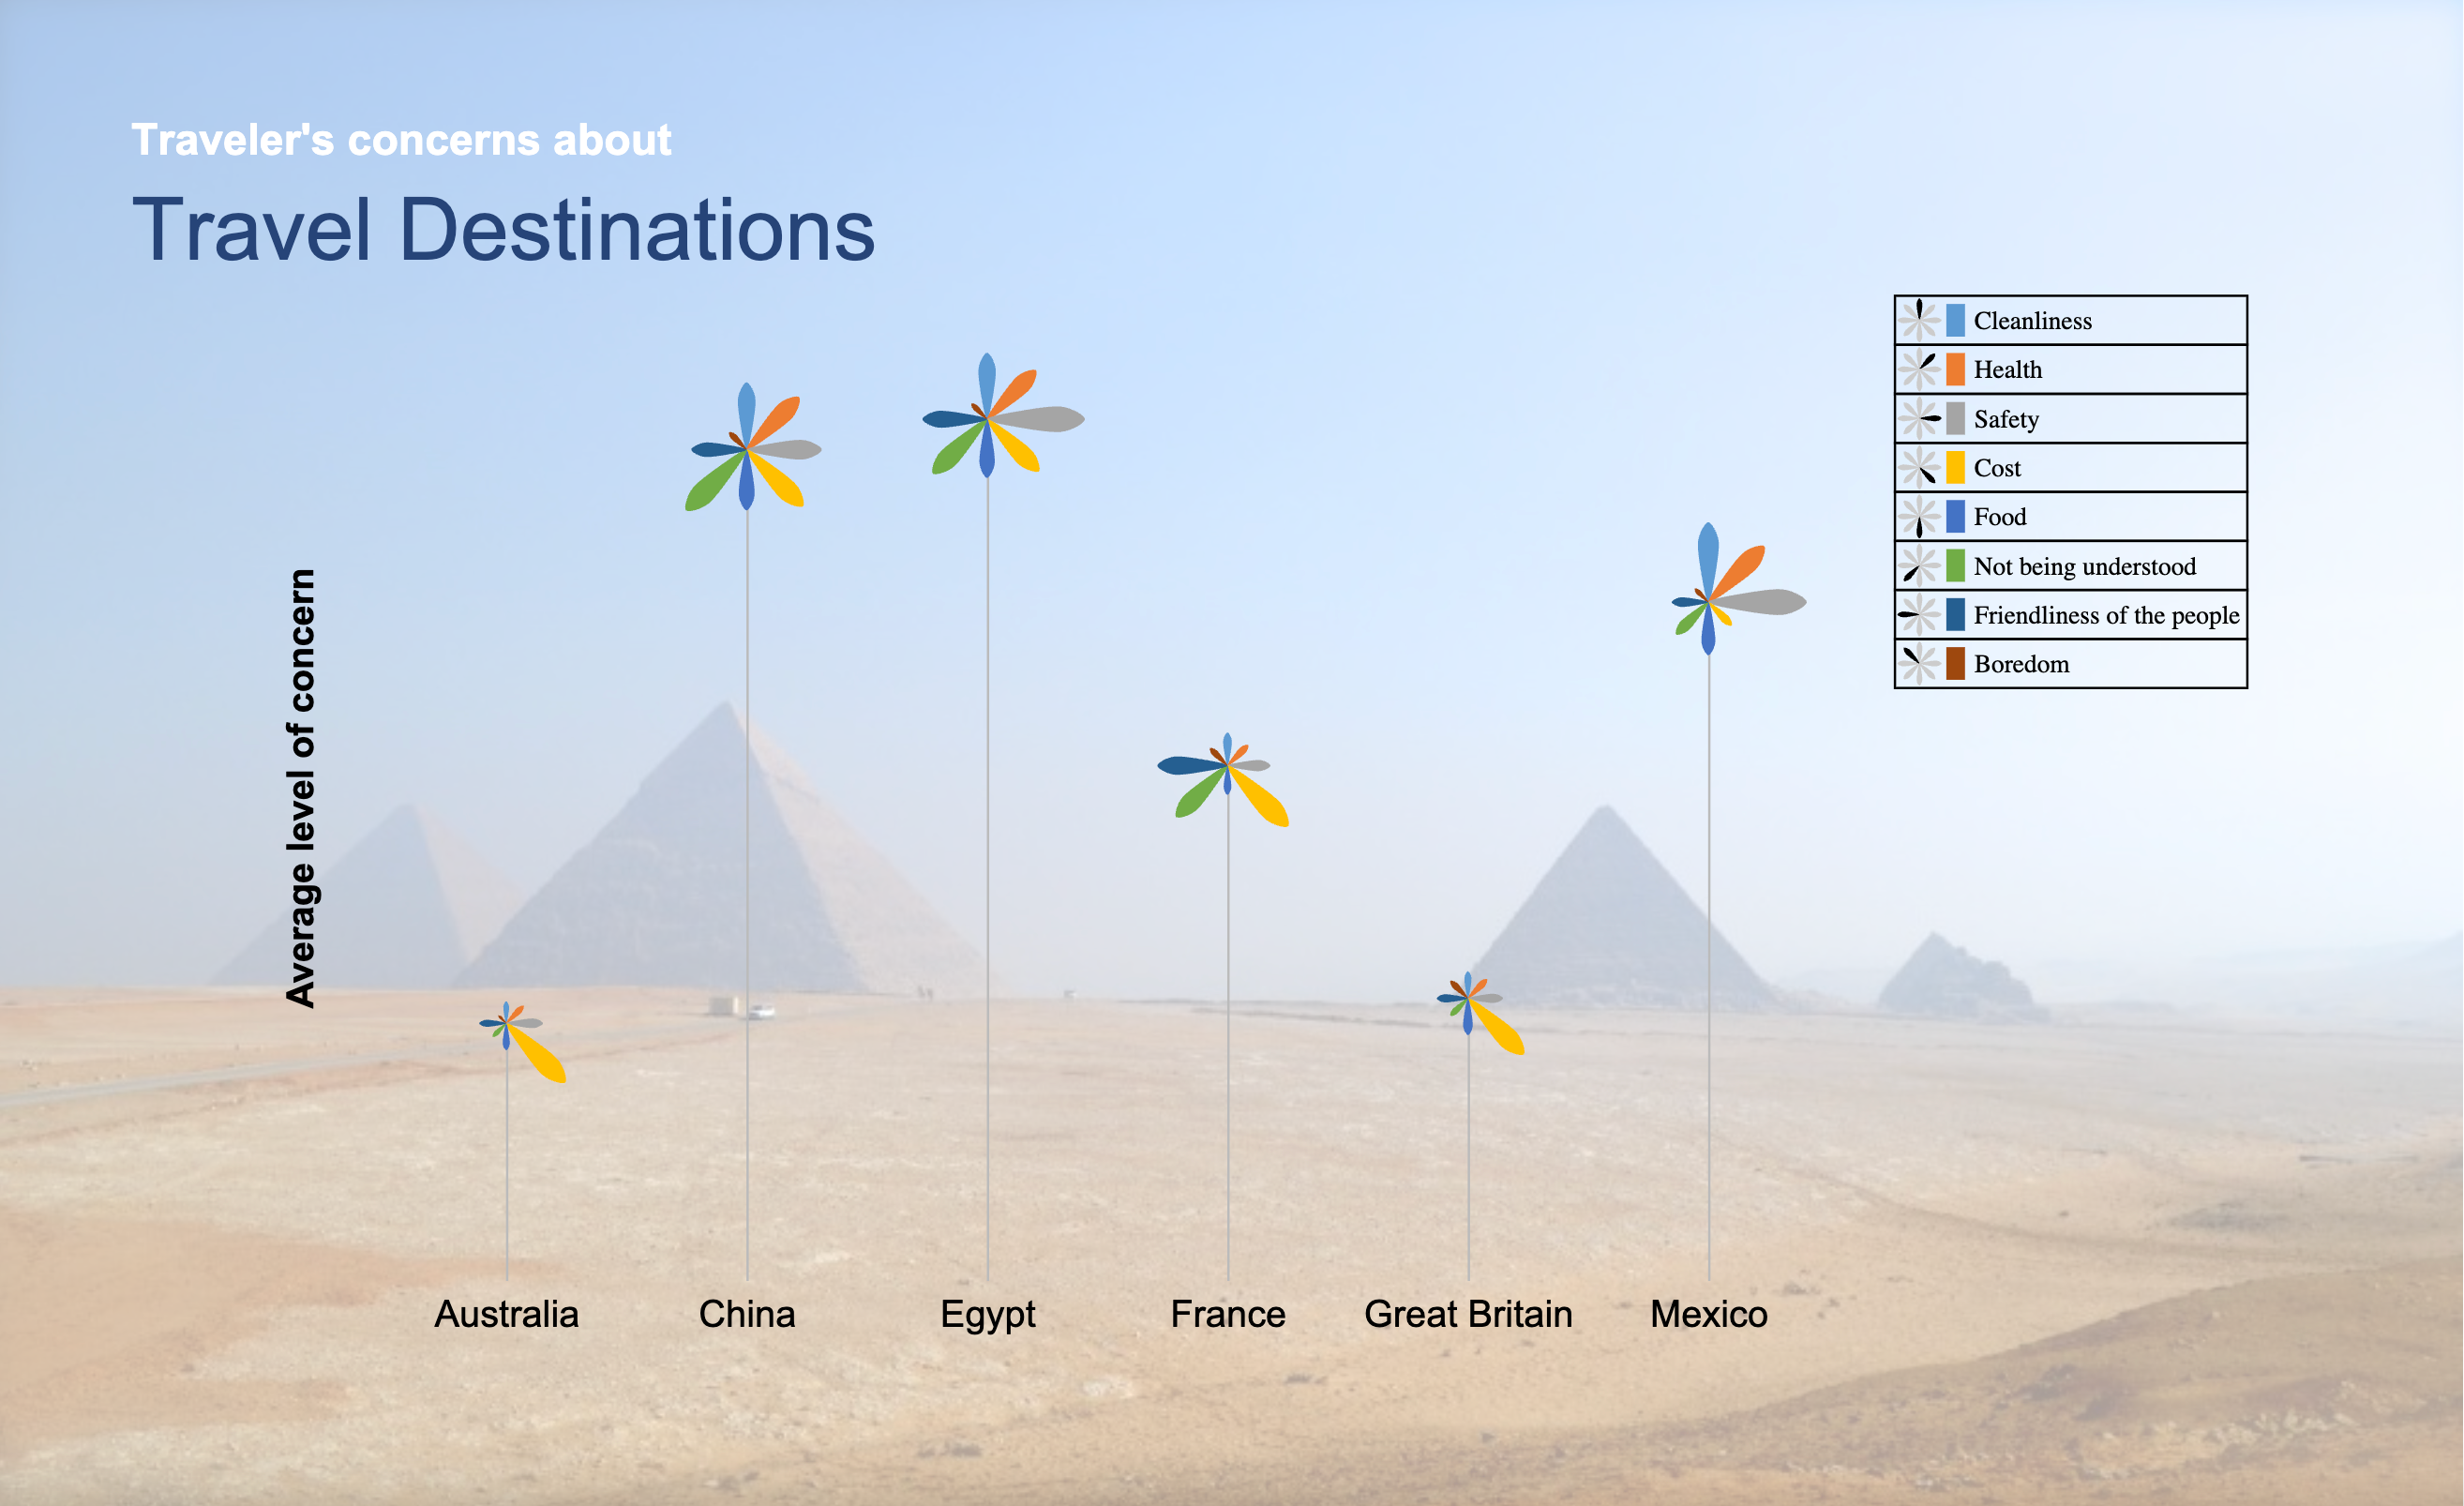
The example below uses a Palm Tree plot, an interactive and impressive visualization. The Palm Tree Plot works well for multi-dimensional data (e.g., when you have big tables that cut across two dimensions). The impact of the visualization can be increased when you insert a background to the dashboard. This background uses perspective, which make the chart even more entertaining.

Take a look at this dashboard in action

A Simple Dashboard
A Simple Dashboard
A Simple Dashboard
A Simple Dashboard
A Simple Dashboard
A Simple Dashboard
A Simple Dashboard
Matt Hubbard

“Displayr is at least 50% faster than just creating a PowerPoint presentation. In some cases, I think it’s even higher than 50%.”

Matt Hubbard VP Data & Analytics, Cygnal
Cookies help us provide, protect and improve our products and services. By using our website, you agree to our use of cookies (privacy policy).
close-image

Ready to chat?
Book a time to learn more about how Displayr will cut your analysis and reporting time in half.

Book your time here
close-link