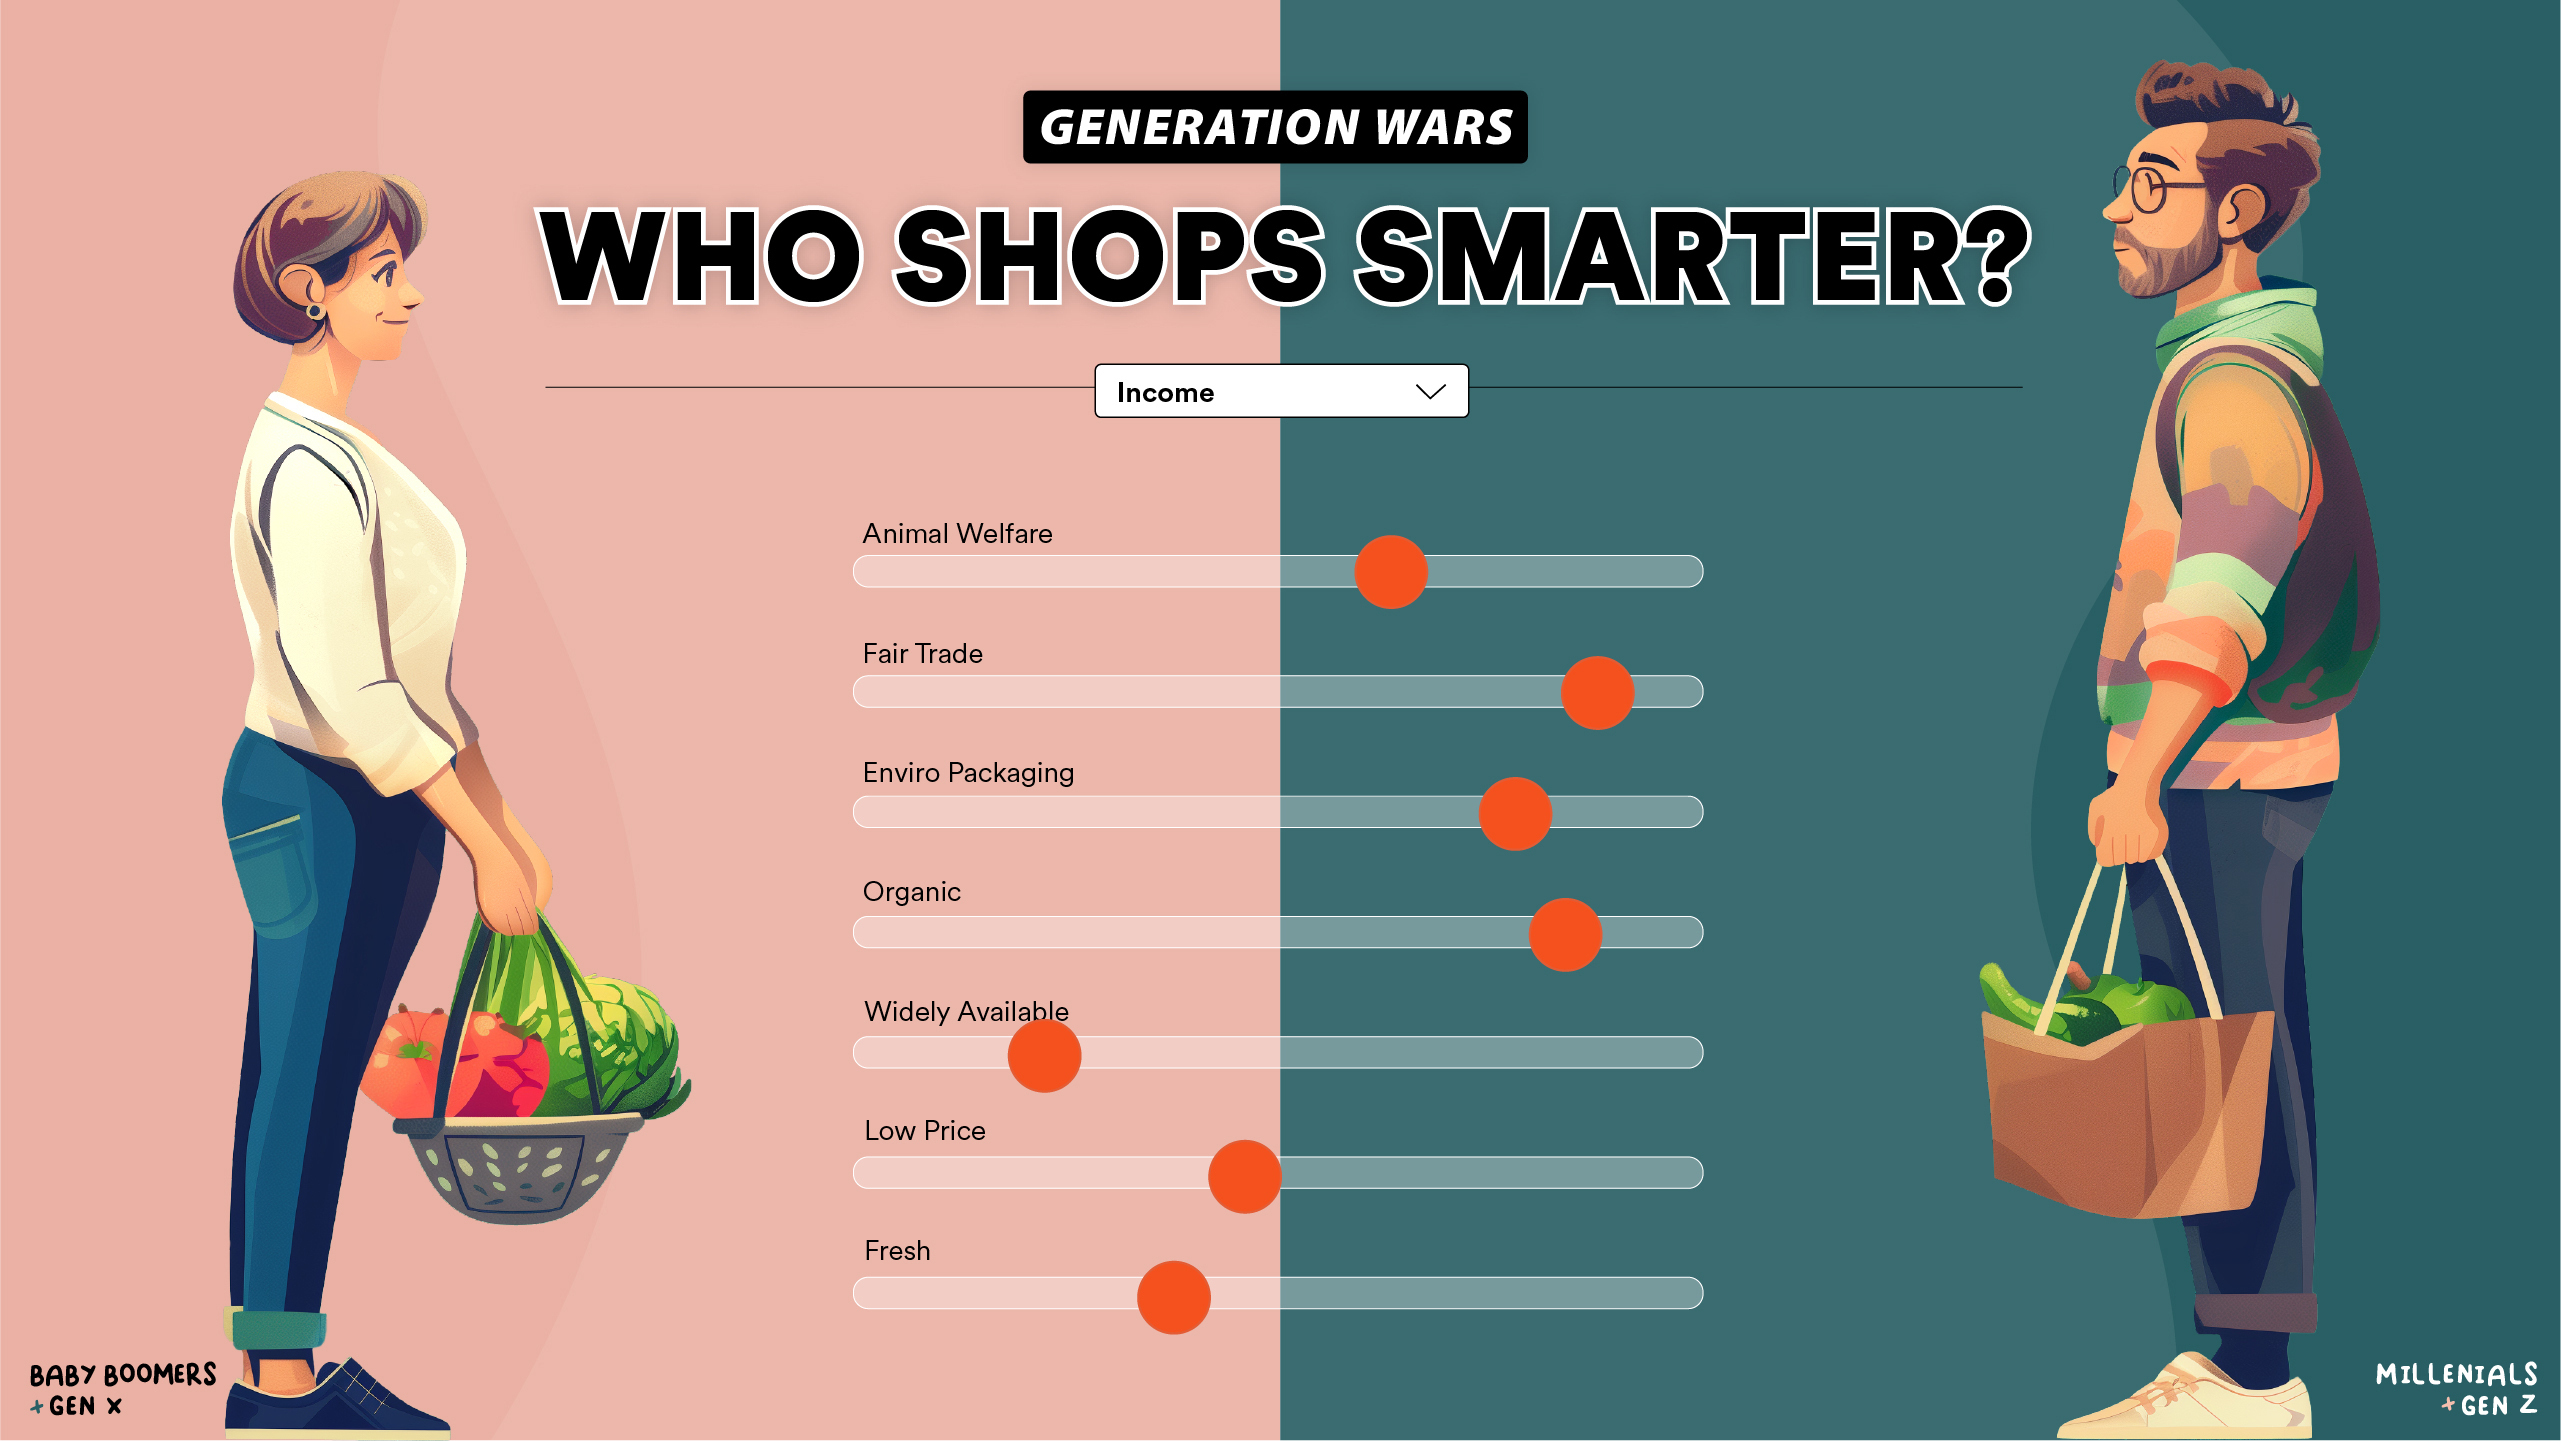
Discover the data story behind generational shopping preferences with our interactive dashboard, “Generation Wars: Who Shops Smarter?” Using comprehensive data from the Statista Consumer Insights survey, this visualization delves into the different values that each generation—from Baby Boomers to Gen Z—considers important when purchasing food.
Experience data storytelling with dynamic dashboards, which transform numbers into compelling narratives more powerfully than conventional static data presentations. Explore how each generation’s unique preferences for factors like organic products, price points, and environmental packaging contribute to their shopping decisions.
Transform your data into a powerful data story. If you are ready to tell a data story that captivates and informs, learn how Displayr’s tools can help you turn complex data sets into engaging visual narratives. Book a demo today to see how you can start sharing better data stories that resonate with your audience and drive engagement.