Looking for a fun and interactive way to explore preferences across different segments? Look no further than our nutty dashboard! You can explore how nut preference varies based on price, flavor, or health with just a few clicks.
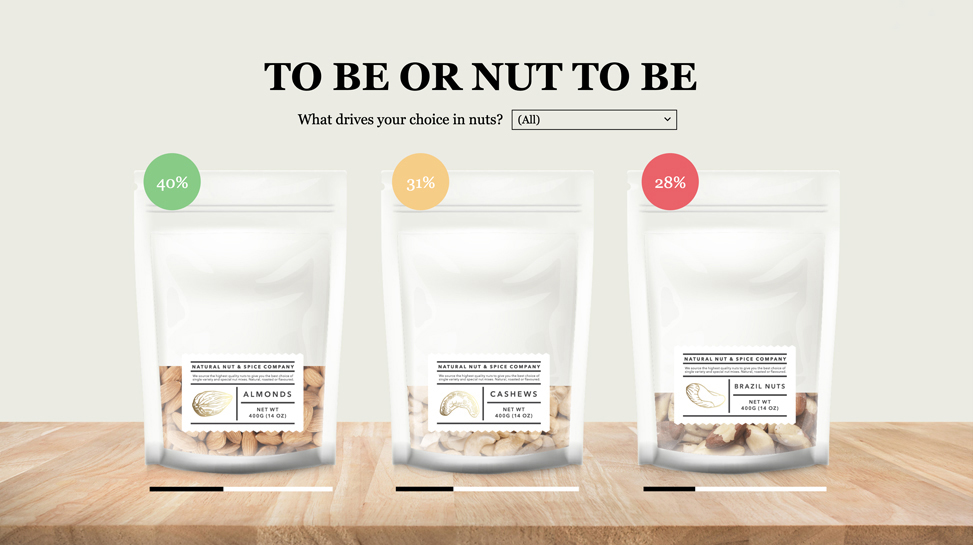
We’ve used pictographs to represent the different types of nuts, and the packets fill up to represent the proportion of buyers. It’s a simple yet effective way to visualize the data. To create this effect for your own products, just upload an image of your product packaging and use a single icon pictograph visualization with the “custom icon” option.
We’ve also added some fun conditional formatting to make things more engaging. With traffic light systems representing the top three preferences, it’s easy to see which nuts come out on top. And you can add conditional formatting to any of the items under the “Number” menu in the visualization selector using the object inspector.
To ensure our visuals were top-notch, we sourced images of the nut packets and nuts from reputable stock image sites like Shutterstock. And if you want to use our dashboard as a template, just click “Edit this dashboard” and switch out the pictographs with images representing your brand.
So go ahead, play around with the data, and discover the nut preferences of different segments in a whole new way!