Get ready to dive into a whole new world of data visualization with our interactive style report! This one-of-a-kind dashboard is like a webpage, which means you can explore insights simply by scrolling down the page.
The best part? Our dashboard automatically updates with new data, so you’ll always be up-to-date on the latest trends and insights. And the range of exciting visualizations we’ve included will make it easy to understand the data.
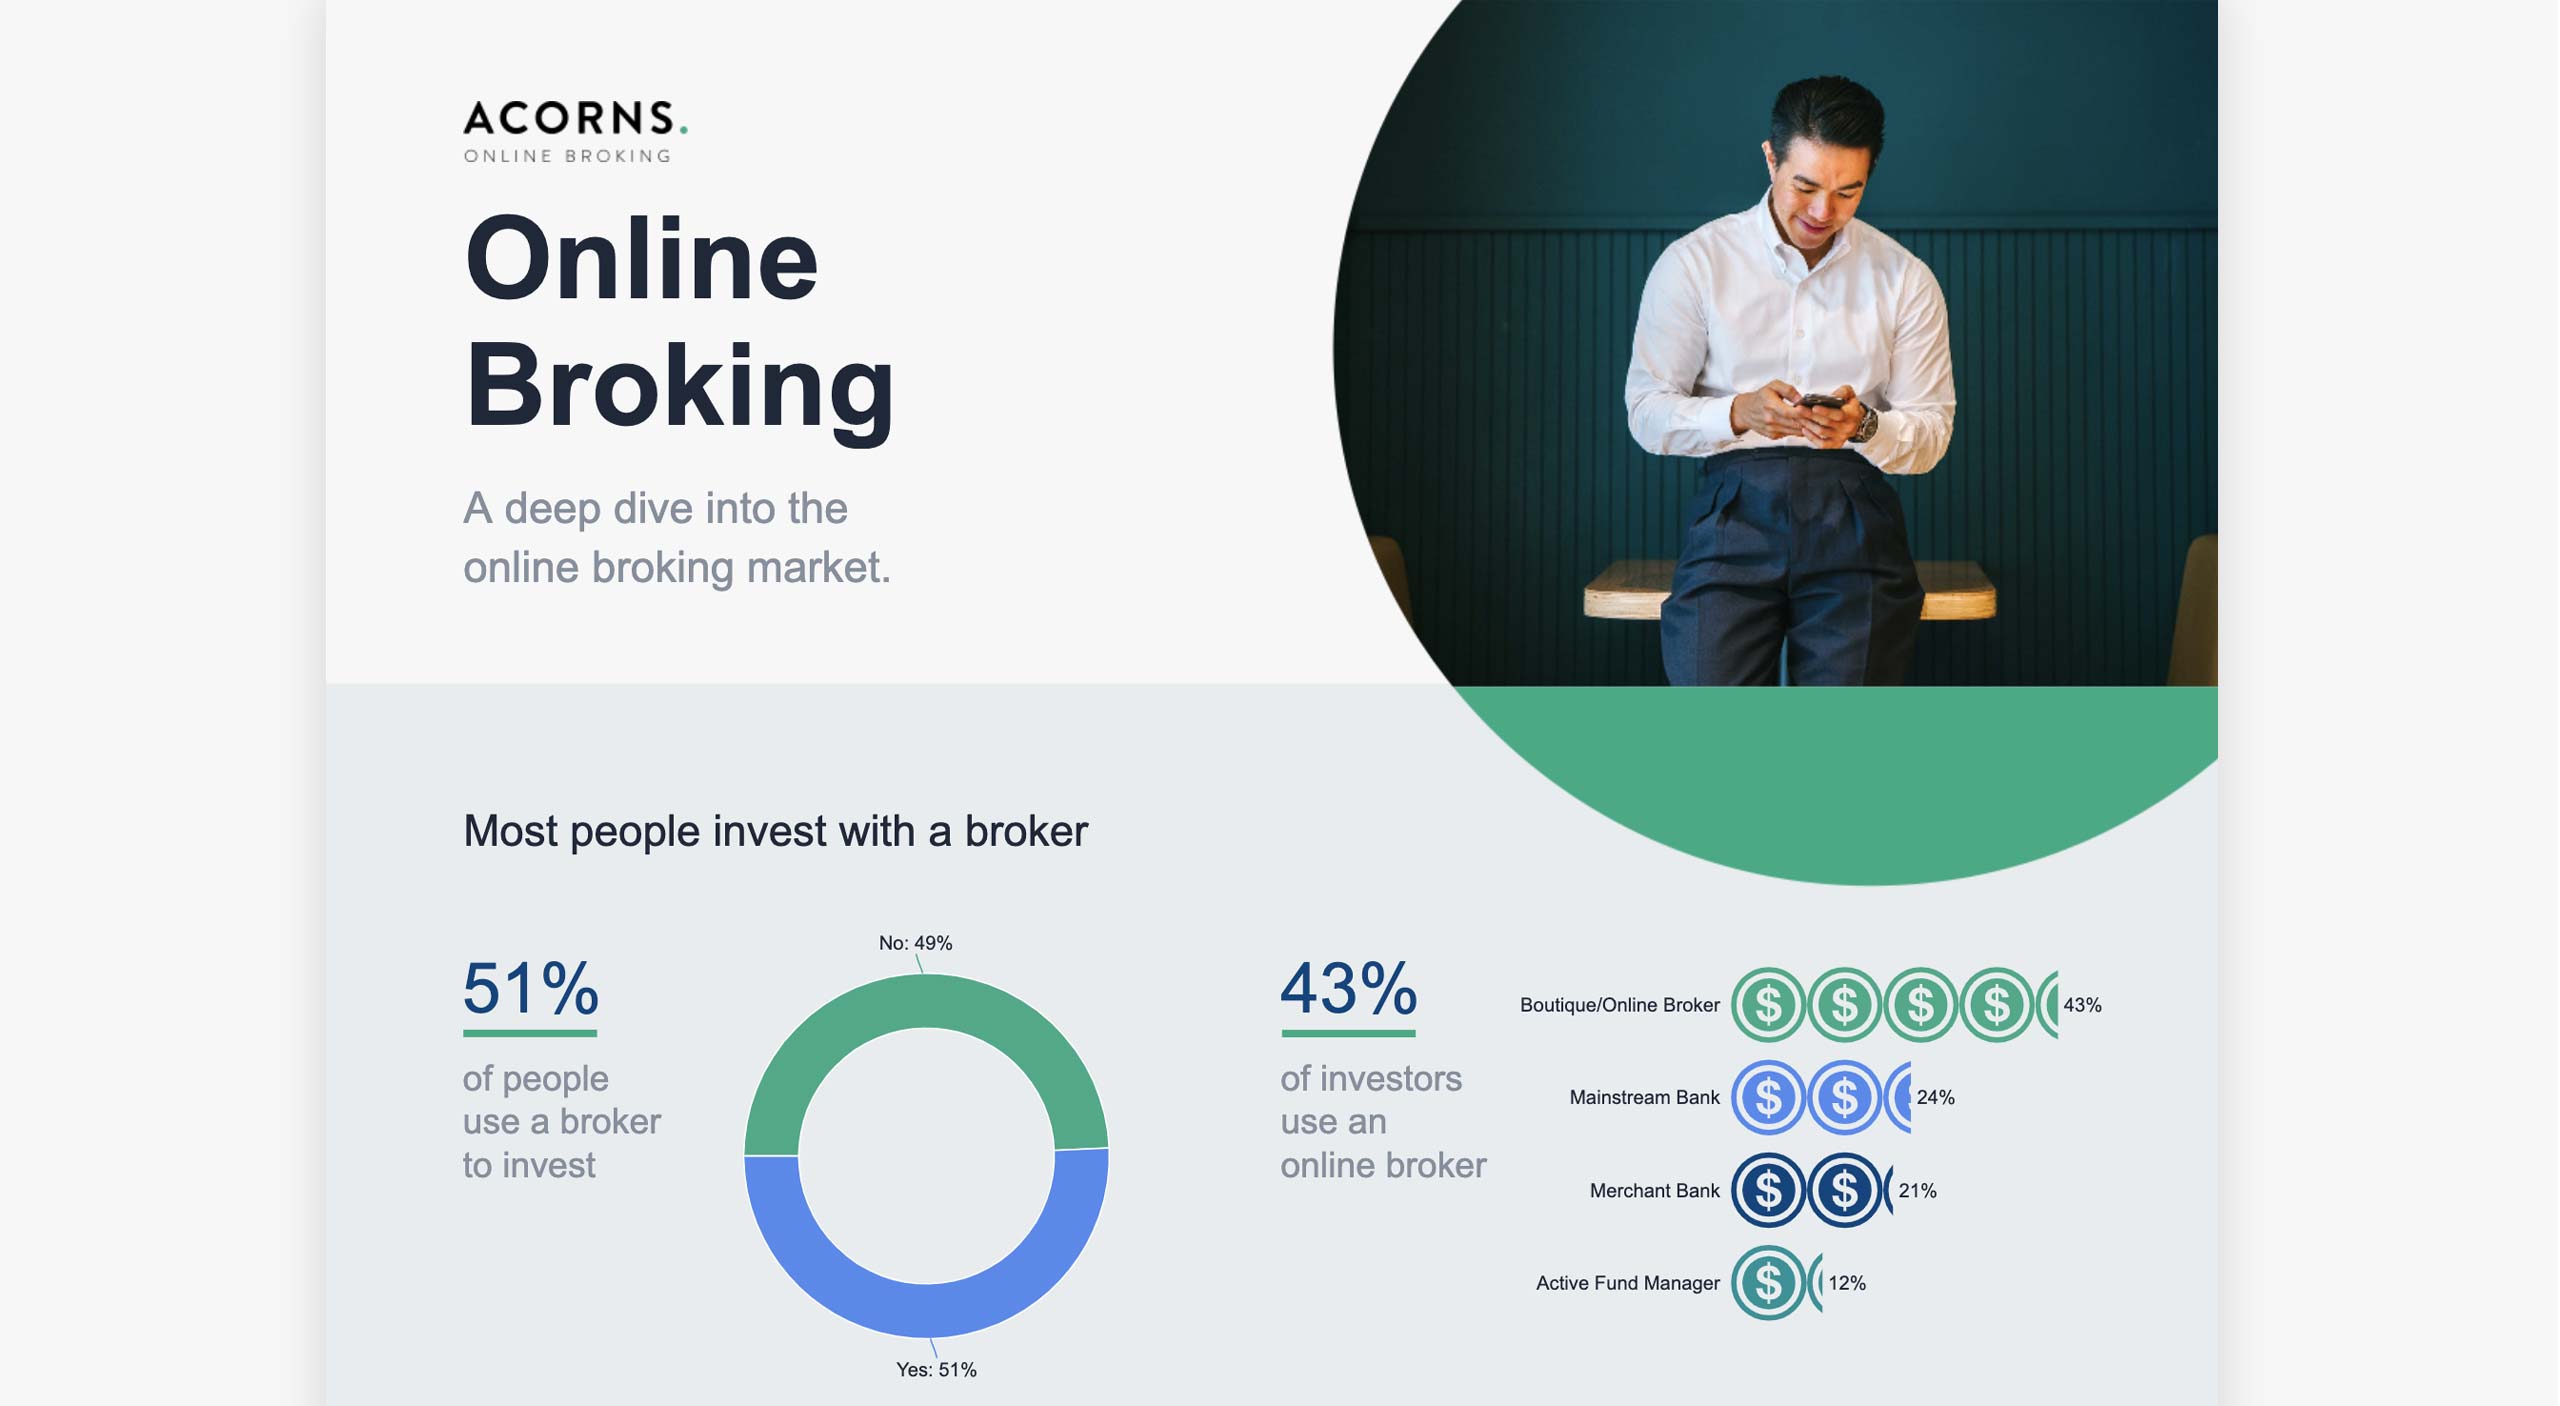
We started by setting the tone with a stunning color palette, stylish fonts, and eye-catching background images on the master slide. From there, we used a range of exciting visualizations, including a bump chart, donuts, single numbers, and a series of pictographs to compare different segments.
Creating this dashboard only took us a couple of hours, but it’s packed with insights that will keep you engaged for hours on end. And because it functions as a webpage, you can explore the data at your own pace.
So what are you waiting for? Dive in and start exploring the data in a whole new way!