
In a previous post (How to Audit Access to your Displayr Documents and Users) I described how to access information about your Displayr usage, including seeing which users accessed documents and when. We can go further with this information and analyze it in more detail to work out who your heaviest users are, and who hasn’t been reading their reports as much as they should have.
Getting the Data
Two types of usage data exist for export in Displayr. Data relevant to your Audit Trail contains information about document access (who viewed or edited a document). The Dashboard Usage Statistics contain records of specific events, e.g. whether a dashboard has been exported, explored, or filtered. You download both these reports from the bottom of the Account > Usage page in Displayr. Simply specify the time boundaries then click the paper icon to download the .csv file.
Importing the Data
To analyze this data in more detail, import it into Displayr as you would any other data file:
- Go to your Documents page and click Add new.
- Give the document a name, then click OK.
- In the document, under Data Sets click Add a data set.
- When prompted, select My Computer to load the file you’ve just downloaded (or select some other location where you’ve saved it).
Analyzing the Audit Trail Data
The Audit Trail data contains a time stamp, the action taken, details about who took the action, and which document (or user) was modified by the action. Let’s start by working out what actions have been taken to your documents, and when:
- Drag the “Action” variable onto the Page to make a table.
- With the table selected, under Inputs > STATISTICS select Cells > Count as well as %.
In my example, which is the usage data for the dashboards we use in our Displayr blog posts, I get a table like this (for the specified period):
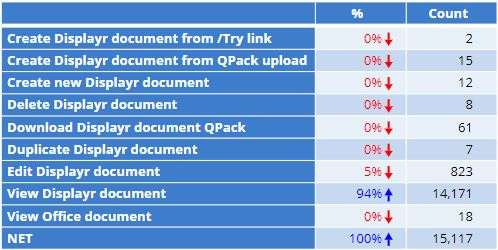
Unsurprisingly, I can see that the documents in this account have had a lot of views!
Most Viewed Document
We can go further than this, of course. To work out which is our most viewed document, I create a new table with the “Document name” variable in the Rows and the “Action” in the Columns. My “Document name” variable, however, is currently stored as text, so first, I convert this to nominal data:
- In the Data Sets select the “Document name” text variable.
- Under Properties > INPUTS > Structure change the drop-down to Nominal: Mutually exclusive categories.
- This will create a new version of the variable: drag this onto the Page to create a summary table.
- Drag the “Action” variable onto the same table, and drop it in the Columns box to create the crosstab.
- On the table, select the “View Displayr document” column, then click Data Manipulation > Sort By – Values Descending > Column %.
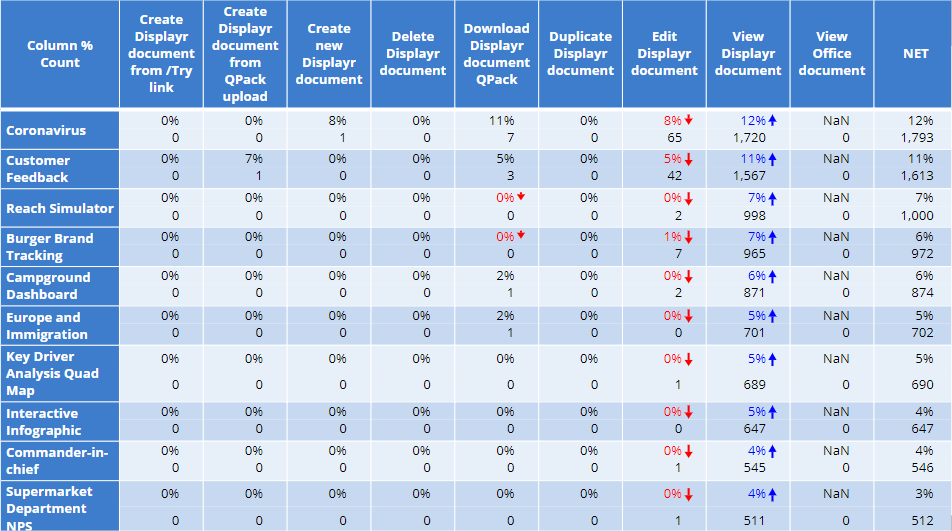
As I write this, I’m working from home because of the 2020 COVID-19 crisis and so it is not surprising that our most viewed document recently is the “Coronavirus” document, with 12% during the period of analysis.
Document Views Over Time
In addition to the above, we can also look at how many times a document has been viewed over time. Let’s look at our top 3 documents, and filter our table to Views only.
- Go to Insert > Filter > New Filter.
- Under Data select “Action”
- Check the box labelled “View Displayr document”
- Alter the label as desired, then click Create filter.
This makes a filter for only the “View” records in the data. Next, we apply this filter to a Summary table of the documents, and hide the rows we don’t want to look at:
- Drag the nominal-data version of “Document name” onto the Page to create a new Summary table.
- With the table selected, under Inputs > FILTERS & WEIGHT > Filter(s) select the filter we just created.
- Still with the table selected, click Data Manipulation > Sort By – Values Descending > Column %.
- Select all the rows on the table below the third line (in my example that’s from “Burger Brand Tracking” all the way down to the bottom of the table).
- Go to Data Manipulation > Hide to hide all these rows to leave only the top 3
Finally, we cross this with the date variable to get a table that shows the views over time:
- Under Data Sets select the “Timestamp (UTC)” variable.
- Under Properties > INPUTS > Structure change the data structure to Date/Time to create a new date variable.
- Drag this variable onto the existing table and drop it in the Columns field.
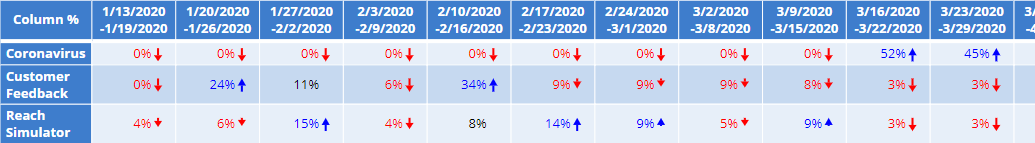
The result is a table that shows the number of views a document has had, as a proportion of all views within a given time period. For example, the week we published our Coronavirus dashboard, it got 52% of all views:
Who Did What?
The user who accessed your dashboards is also stored in the data, assuming that they’ve logged into to Displayr to do so. However, the principles outlined above apply here too. To create a table where you figure out who viewed a dashboard most often, cross a nominal-data version of “Performed by user name” by the “Document name”. Alternatively, consider crossing the user names by the date variable and filtering on a particular document to see who has accessed it over time. Finally, you could also cross the “Performed by user name” by “Action” and filter on a specific document to see exactly who did what to that document.
Analyzing the Dashboard Usage Statistics
The Dashboard Usage Statistics provides more detailed information about what actions were taken to a specific dashboard and by whom. As with the above examples, the principles are the same, but the data is somewhat different. You have available “Event” data which stores the actions taken when viewing the dashboard, the time that action was taken, and who performed that action.
A simple summary table of the events that are recorded for our blog post dashboards looks like this:
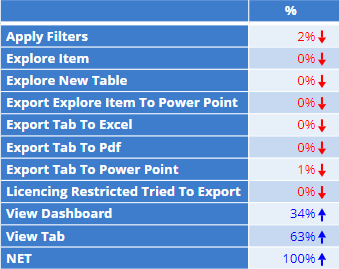
From this, you can easily see that 63% of events are clicking between tabs on dashboards, and that 2% of events involve applying filters from the Filter drop-down. As before, this can be crossed by date or users, filtered to specific documents, or specific actions, to get further insight into how, exactly, your dashboard has been used.