

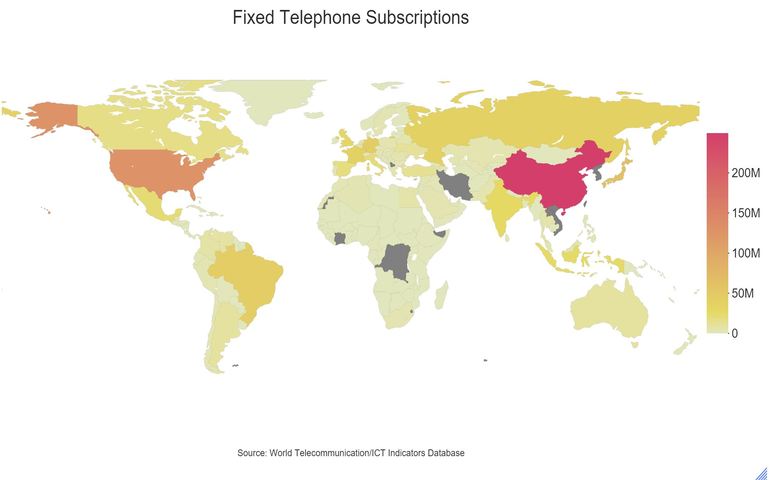
Geographic map visualizations are a great way to show comparative values across countries, states, or regions. The geographic map shades the color of each location in the map in proportion to data values. Here we’ll look at how to create a state-level geographic visualization in Displayr.
This post will run through step-by-step instructions but you can also easily follow our in-app instructions with Displayr’s free geographic map maker.
The first step in creating a geographic map chart in Displayr is setting up your data. For this type of chart, you should start with a table of figures, with row labels that correspond to the locations (i.e., countries, states or regions) you want to display in the map chart. The remaining columns should contain the statistics to be shown on the map. In Displayr, there are a couple of different ways to setup this table.
Click here for an interactive tutorial on creating maps
Creating a source table
Each of the methods I’ve described below assumes your data set has been loaded into Displayr using New Data Set to add the data to your current project.
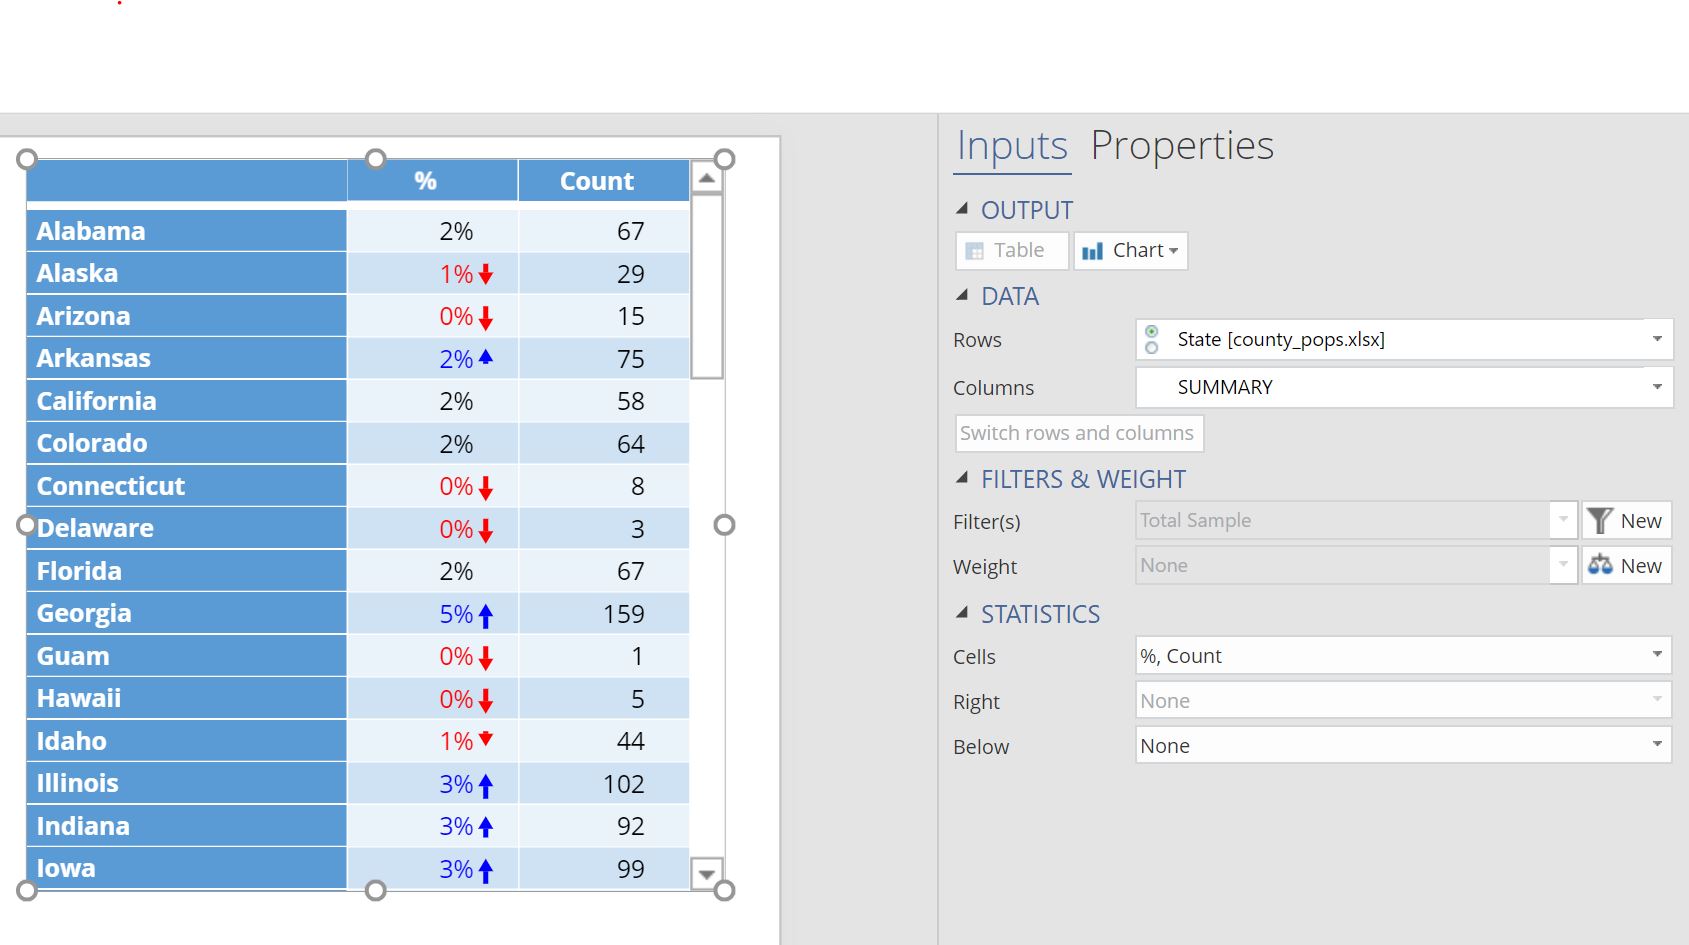
A SUMMARY table
A SUMMARY table, with a state or country question in the Rows drop-down menu, will allow you to map the number of people / proportion of people in each region from your sample. An example of this table would look like this.
Alternatively, you could have a SUMMARY table of a Binary – Multi question or Numeric – Multi question, where there is one row (variable) for each geographic region that you want to include in your map. In this example, I have a question where the respondents have given ratings for several countries.
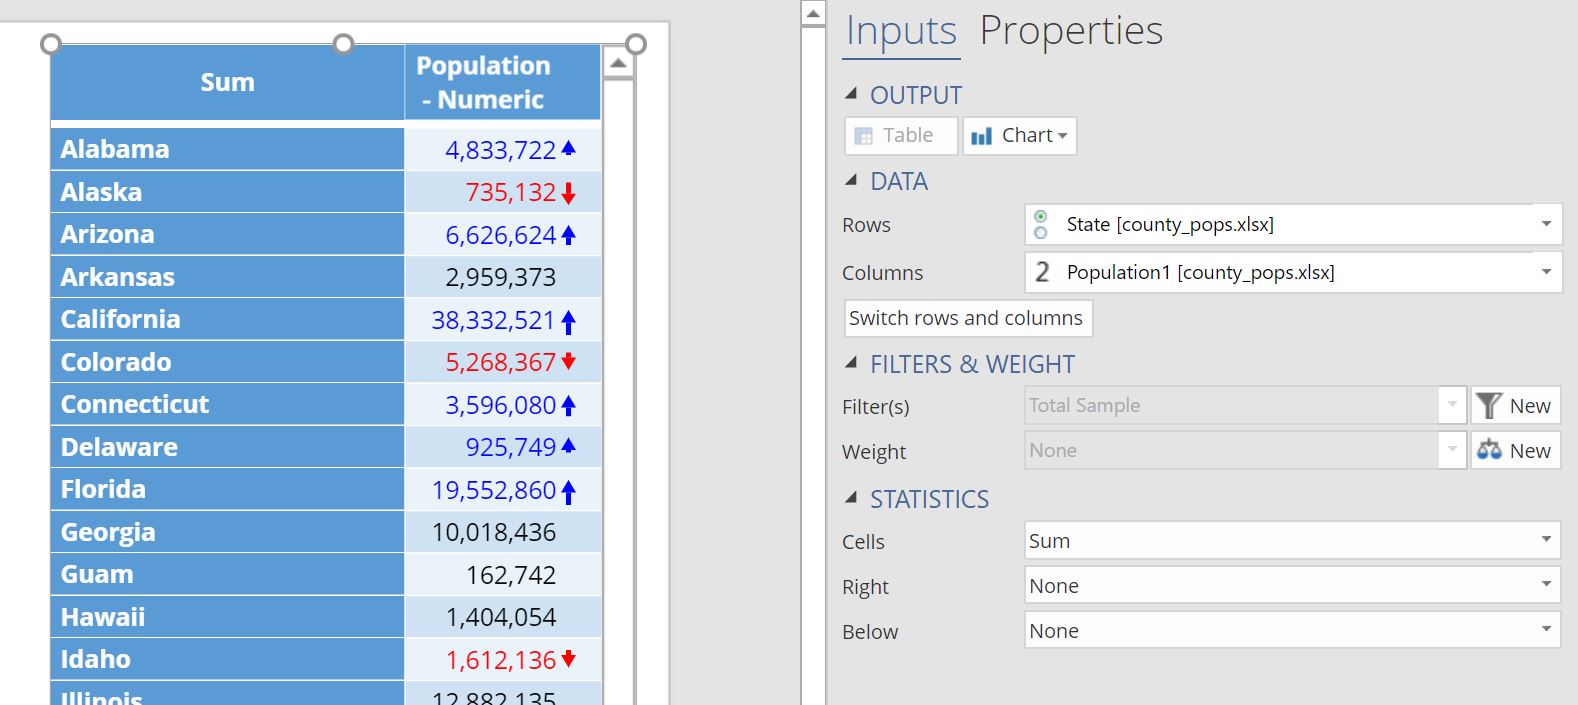
A crosstab
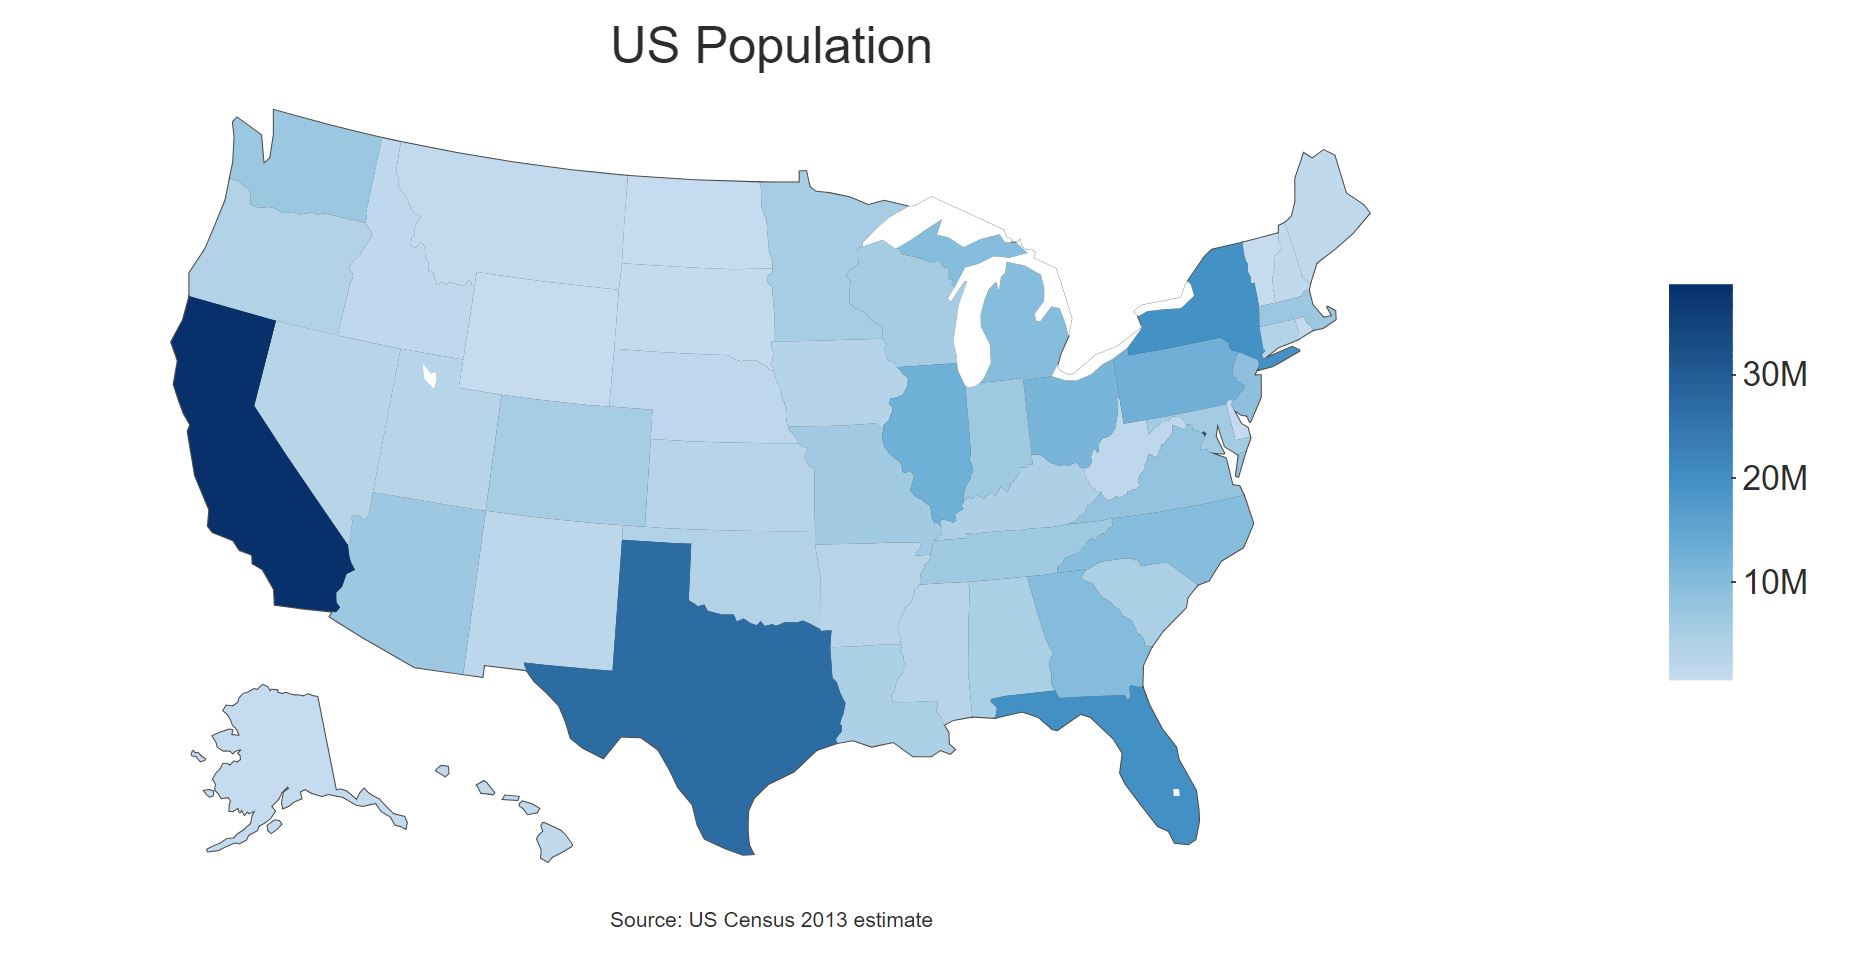
A crosstab setup will have a state or country question in the Rows and a numeric variable in the columns. In the example below, I’ve created a crosstab table showing state by population. Alternatively, you could have a SUMMARY table of a Binary – Multi question or Numeric – Multi question, where there is one row (variable) for each geographic region that you want to include in your map.
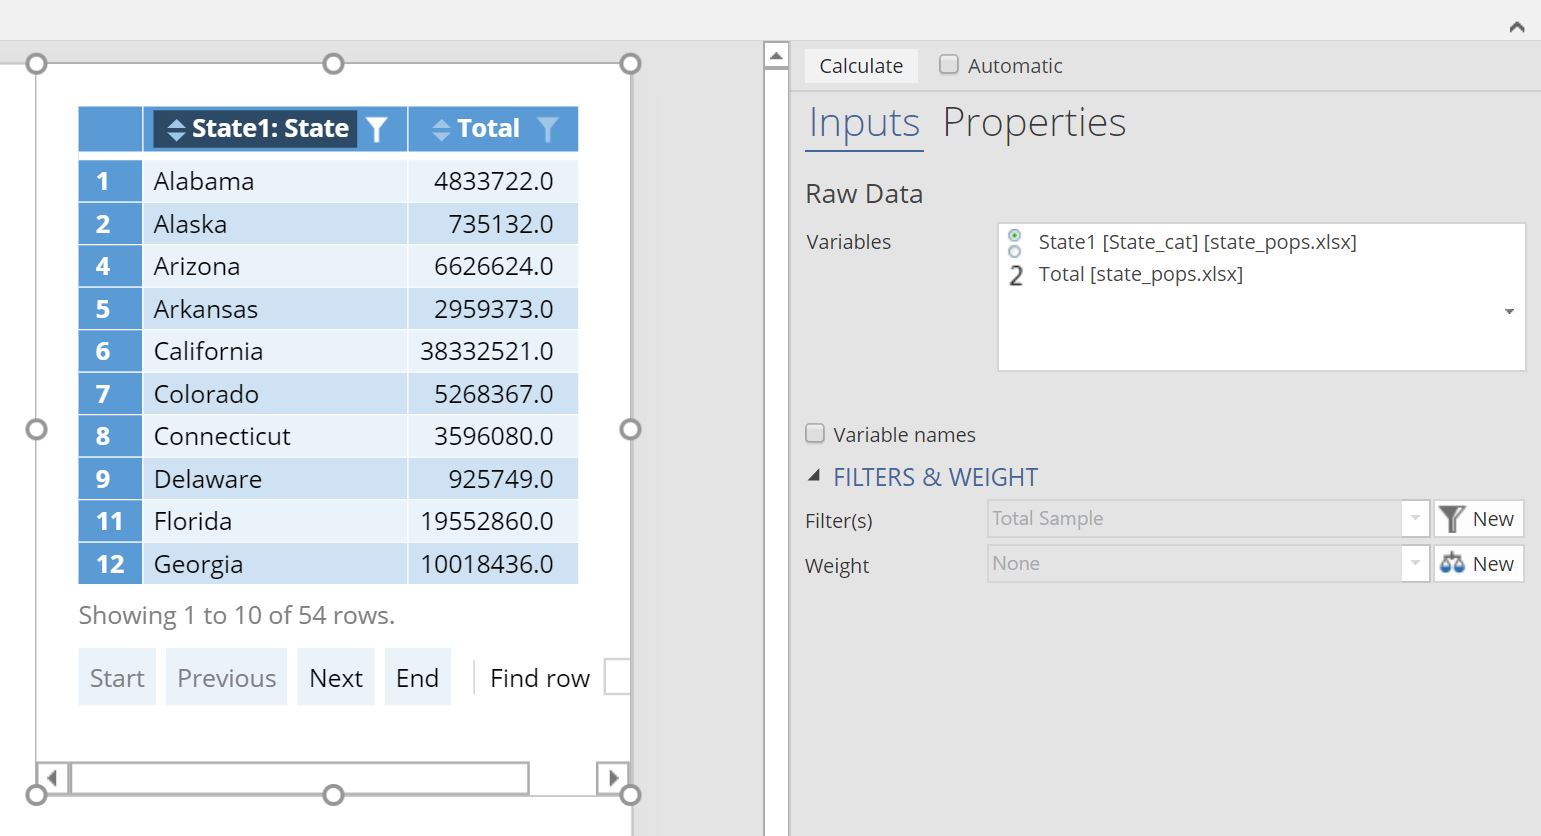
Raw data table
In some situations, our data may have one row per geographic region (state or country, for example) and no tabulation, where aggregation or calculations are needed on the data. When this is the case, you can create a raw data table using Insert > More (Analysis group) > Tables > Raw Data to display the raw data in a table form. In the example below, I’ve create a raw data table from a data set with just 54 rows (US states and territories) and selected the State and Total (population) variables.
Creating the geographic map
Any of the above tables can be used as input to the geographic map visualization. To create this visualization in Displayr, first select Insert > Visualization (Analysis group) > Geographic Map. A chart object is created in the Report tree. From the Objector Inspector we can now feed a table from above into the map function. In this example, I’ve selected the state populations raw data table created above in the Output in ‘Pages’ drop-down box. The geographic map charting function will automatically recognize the country, state or region names and name variations. Those that cannot be recognized will be omitted from the chart.
Note that there are actually three different methods for providing input data to the map:
- Output in ‘Pages’ – select an output from any of your Pages. The name of a table can be found in the Object Inspector under Properties > General.
- Variables – select individual variables from your data set.
- Paste or type data – paste the data into spreadsheet input tool. This is a great approach when you have a set of numbers computed elsewhere and you just want to create a quick chart.
For this example, I select raw.data from the Output drop-down box to select the raw data object we created above.
Remember, you can also modify many of the chart properties including the title, sub-title, color scheme, fonts, etc. under the Chart section of the Object Inspector. In the example above, I’ve modified a few of these properties including the title, footer, legend font size and color scheme. You can easily change the different chart settings and recalculate the chart as needed.
Tips for getting the geography right
The geographic map visualization has an algorithm for matching the geographic labels to regions in several databases. If a label is misspelled or out-of-place, the algorithm may not be able to match it to the intended place. There are some tips that you can use to get your map working successfully:
- Don’t mix between states, continents, or countries. You must choose to create a map that shades one kind of region.
- If using states, use states from a single country only. For example, don’t mix states of the US with states of Australia.
- If you run into trouble trying to use states, try using the abbreviated state names.
- Similarly, countries may be specified using names or ISO codes.
In addition to continents, countries, and states, the following kinds of other regions are also allowed:
- Regions: USA (i.e. Northeast, Midwest, South, West)
- SA4 areas of Australia
- Zip codes: Australia, UK (districts, e.g. BD21), USA
Finally, there are two different mapping packages available to use, and they each have different maps available. You can change the setting by selecting the Charts section of the Objector Inspector, and going to the Map package option. The options are:
- plotly – This option loads faster for more detailed maps. However, only USA is available for state or region maps.
- leaflet – This option offers continent maps, and a wide range of single-country state maps (including Australia).
Now that you’re an expert on geographical maps, check out what else you can do in Displayr.
