How to run Linear Discriminant Analysis in Displayr

In this post I explain how to perform Linear Discriminant Analysis in Displayr. Linear Discriminant Analysis is a machine learning technique that can be used to predict categories.
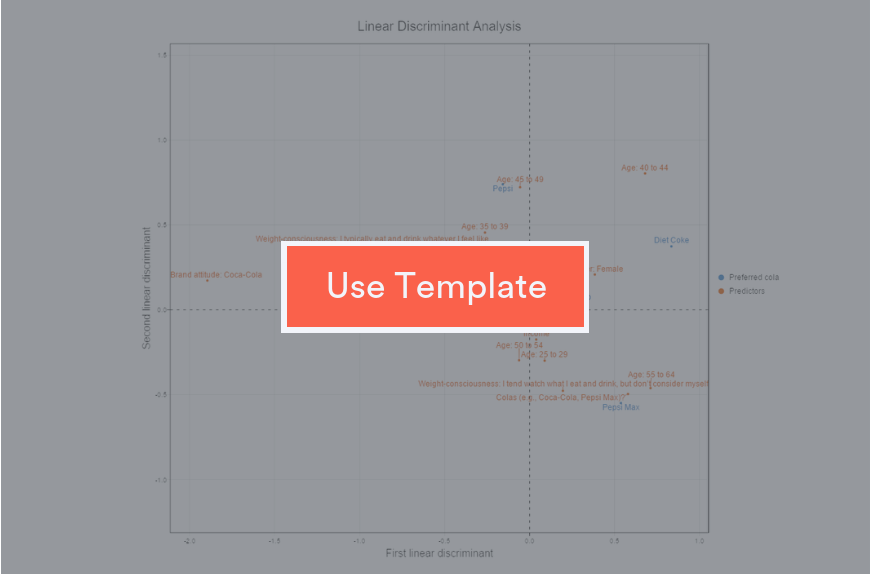
This post is a step-by-step guide to how to do Linear Discriminant Analysis in Displayr. You can do this easily by using this LDA template! Just follow the instructions to create your own Linear Discriminant Analysis.
If you are not familiar with Linear Discriminant Analysis (LDA), and want to learn more then, click here for an introduction. As this is a practical guide, it does not require a deep understanding of the algorithm.
The data set I’ll be using describes different types of glass based upon physical attributes and chemical composition. You can read more about the data here. For the purposes of my analysis all you need to know is that the outcome variable is categorical (7 types of glass) and the predictor variables are numeric.
Like other supervised machine learning algorithms, it is first trained on a labelled data set. This in turn enables it to predict categories on a new data set. We'll also be randomly split the data into a larger 70% training sample and a smaller 30% testing sample. The training sample is used to build the model, and then we can independently verify the accuracy using the unseen training sample.
Step 1: Importing the data
Displayr has many methods for loading data. This includes drag-and-drop (of various file types), importing via SQL, via URL and using R code. In this case I will use a URL to bring in a .csv file.
- Open your document and start a new blank page: Home > Page Layout > New Page > Title Only
- Navigate to Insert > New Data Set > URL and paste in the following (without quotation marks): "http://wiki.q-researchsoftware.com/images/c/ce/Glass.csv"
- The data will appear in the Data Sets tree in the bottom left of the screen. Highlight the data set "Glass.csv" on the left.
- Insert > Utilities > Filtering > Filters for Train-Test Split. This splits the data into a 70% training set and a 30% testing set. (You can see this in a summary table if you drag the newly created question, Train Test Split, from the data tree on to the page).
Step 2: Performing Linear Discriminant Analysis
Now we add our model with Insert > More > Machine Learning > Linear Discriminant Analysis.
- Click on the model and then go over to the Object Inspector (the panel on the right-hand side).
- For Outcome, select Type from the drop-down list.
- For Numeric predictors choose Refractive Index and the 8 elements Na, Mg, Al, Si, K, Ca, Ba and Fe. Leave the other settings to their defaults.
- Select the output box on the page, and then from the Inputs tab of the Object Inspector, choose Training sample from the Filter(s) drop-down box.
The output should appear as below.
It is useful to name your page with the analysis. Click on the text "Click to add title" at the top of the page to insert a title. Type in "LDA model with training sample".
The model is predicting Type, which is an integer from 1 to 7, and is correct for 64% of the cases. Note that there is no data from Type 4.
Step 3: Validating the model
Overfitting is when a model is paying too much attention to aspects of the training data that are in fact random and do not generalize to unseen examples. The model has gone beyond learning the relationship between the predictor and outcome variables and is effectively memorizing the training data. Hence we do not use the accuracy on the training sample as a benchmark of quality. Instead, let's test how well this model predicts on the data from the testing sample using a Prediction-Accuracy Table.
Select the model on the page, and then navigate to Insert > More > Machine Learning > Diagnostic > Prediction-Accuracy Table. The shaded table output appears on top of the original output so we will move it to a new page. Go to Insert > New Page > Title Only to create a new blank page. Click back on the original page (see Pages on the left of the screen above Data). Drag the Prediction-Accuracy Table on to the new page then click back to the new page. Name your page "LDA accuracy on testing sample" by typing this into the blank title bar at the top of the page.
The accuracy is currently calculated for the whole data set. To change this, first click on the table output and from the Inputs tab of the Object Inspector, choose Testing sample from the Filter(s) drop-down box.
The output should appear as shown below, with a training set accuracy of 57.81%.
The discriminant function coefficients can be accessed from Insert > More > Machine Learning > Diagnostic > Prediction-Accuracy Table.
Try it yourself
You can see the document I created by clicking here. If you'd like to repeat the process or play with your own data, use this template.
In summarize, the main steps I have just performed are,
- Import a data set
- Split the data into testing and training sets
- Perform Linear Discriminant Analysis on the training set
- Calculate the accuracy on the independent testing set (using a Prediction-Accuracy table).
I used the default LDA settings but Displayr has many more menu options to explore which are described here.


