Why use simulated data to check your choice model?
You can generate choice model designs by using numerous methods with different specifications. Likewise, there are a variety of ways to check and compare them. The most common methods are D-error and design balance. However, these metrics do not directly measure how a design would perform in real life where we use it for a survey and analyse the results with a choice model.
Running a survey is expensive and time-consuming, so checking designs by running a small initial survey and fitting a model is costly. However, it is possible to generate simulated data by making reasonable assumptions about respondents preferences for the attribute levels. You can use this simulated data to check and compare designs before collecting the real survey data.
Inputs: design
To fit a model with simulated data you will first need to create a latent class analysis output, by clicking on Insert > More > Conjoint/Choice Modeling > Latent Class Analysis. You need to supply the choice model design in any of the following formats:
- a choice model experimental design output generated from Insert > More > Conjoint/Choice Modeling > Experimental Design
- a Sawtooth CHO file
- a Sawtooth dual format design file
- a JMP design file
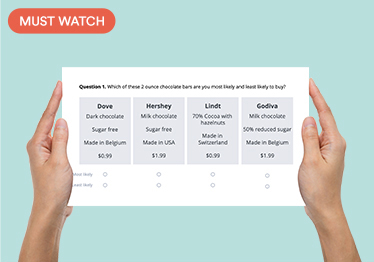
For the example in this article, I will be using a choice model experimental design with eggs attributes (Weight, Quality, Price) generated using the Efficient algorithm.
Inputs: priors
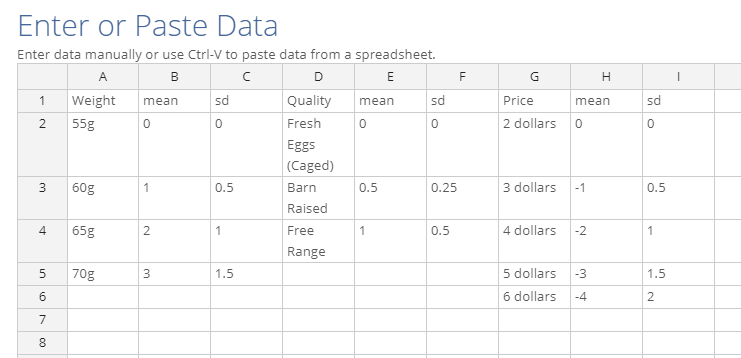
Once you have supplied the design, the next step is to choose Simulated choices from priors in the Data source. This indicates to Displayr that we want to use simulated data instead of real survey data. A red button called Enter priors will appear, which when clicked on will bring up an Excel-like data editor. Enter the priors here, in the format I’ve shown below, where Weight, Quality and Price are the attribute names, and the cells below these names are the attribute levels.
Make sure that the columns to the right of the attributes are titled either “mean” or “sd”, and contain the means and standard deviations of the levels. Note that the first levels need to be zero due to the coding of the design. No priors were specified for the Alternative parameters as they were not part of the design, but you can include them if you want.
Alternatively, if you have supplied a choice model experimental design output, there is an additional Prior source control which has the option Use priors from design. As the name suggests, Displayr will use any priors provided in the design output to generate the simulated data. If no priors are present, then Displayr will use priors of zero. This will cause the simulated choices to be random and independent of attributes.
For the purpose of checking the design, I would recommend specifying non-zero priors for all attribute levels in the design, so that you can see how the design performs for each level.
Inputs: simulated sample size
Next, choose the simulated sample size, which is the number of respondents to simulate. The default is 300, but generally this should be larger if there are many parameters in the model, especially if you find that estimated parameters do not match the model.
Inputs: others
 For the purpose of checking the design, I would generally first run a single-class latent class analysis without any questions left out, which is the default, but you may choose different settings or even run Hierarchical Bayes instead. Once you are done, click on the Calculate button to run the analysis with simulated data.
Model output
The table below shows the output from running a single-class latent class analysis with the priors shown previously. The model has only roughly deduced the mean priors, but this is a limitation with the model rather than the design. There is no variation between respondents, as only one set of coefficients is estimated. The prediction accuracy is not high, but it is around the usual level for a latent class analysis. You can also use simulated data to determine what level of accuracy to expect from real data, assuming respondents have certain preferences.
The next table shows the output from a Hierarchical Bayes analysis on the same data. The means are much closer to the priors than with latent class analysis, although the standard deviations are smaller than the priors and the respondent distributions are skewed. This problem is related to the model rather than an issue with the design. The prediction accuracies are higher, due to the flexibility of Hierarchical Bayes model. Overall, there do not seem to be any issues with the design. I would be concerned if the model failed to converge, if parameter estimates were vastly different from the priors, or if prediction accuracies were low, or too high (i.e., close to or equal to 100%). When out-of-sample prediction accuracies are too high, this means that the model is overfitting to the data. This situation can be addressed by increasing the number of respondents or questions per respondent, or decreasing the number of attributes or attribute levels in the design.
Standard errors
The last table displays parameter statistics from the latent class analysis above. This was created by selecting the model output and clicking on Insert > More > Conjoint/Choice Modeling > Diagnostic > Parameter Statistics Table. The parameters for which a prior was specified all have small standard errors relative to the coefficients and hence a high level of significance. It would be worth investigating the design if any of these parameters were not significant, as a potential issue may be that the design fails to adequately cover some levels. You can also compare different designs with the same specifications and settings against each other, with lower standard errors indicating a better design.
Summary
I have described the inputs required to create a choice model output with simulated data, and the outputs to look for when checking and comparing designs in Displayr. It is a good idea to run a design with simulated data first, to check for any issues, before spending valuable time and money giving it to respondents. Readers interested in seeing how simulated data can be used to compare design-generating algorithms should check out this comparison. Please see this Displayr document for the outputs mentioned in this article.
Need more tips? Check out our other posts on Market Research!