
How To Make An Area Chart in R | Step-By-Step Guide
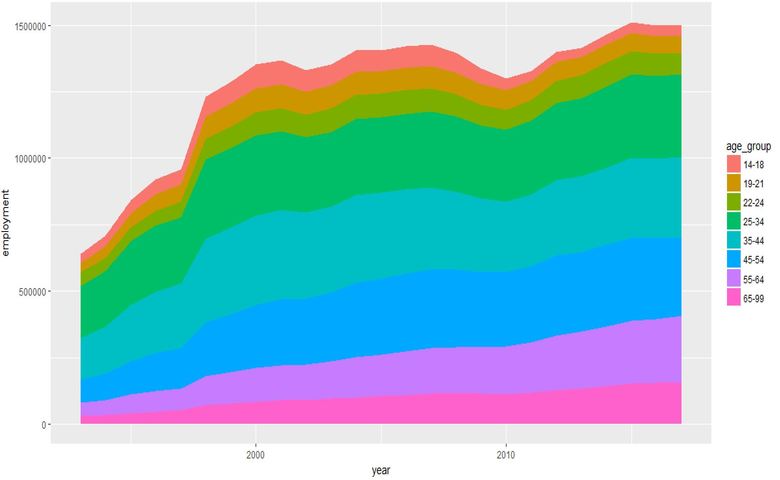
Area charts are useful for visualizing one or more variables over time. We can create area charts in R using one of the many available plotting packages. In this article, we’ll examine how to create an area chart in R using the ggplot2 package. Don’t forget though, you can easily create an area chart for […]
How to Make an Area Chart in Displayr
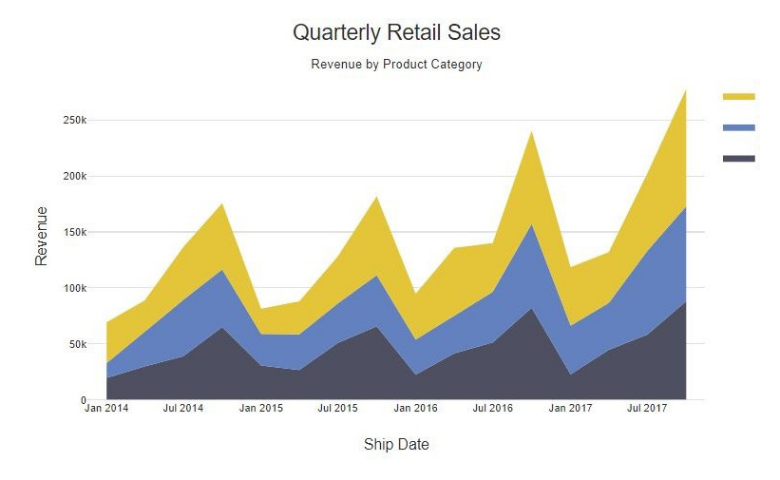
An area chart is based on a line chart, with the area between the line and the x-axis colored to illustrate volume. In this post, we’ll explore how to create a standard area chart as well as a stacked area chart in Displayr. You can easily create your own area chart for free with Displayr’s […]