

An area chart is based on a line chart, with the area between the line and the x-axis colored to illustrate volume. In this post, we’ll explore how to create a standard area chart as well as a stacked area chart in Displayr.
You can easily create your own area chart for free with Displayr’s area chart maker!
Standard Area Chart
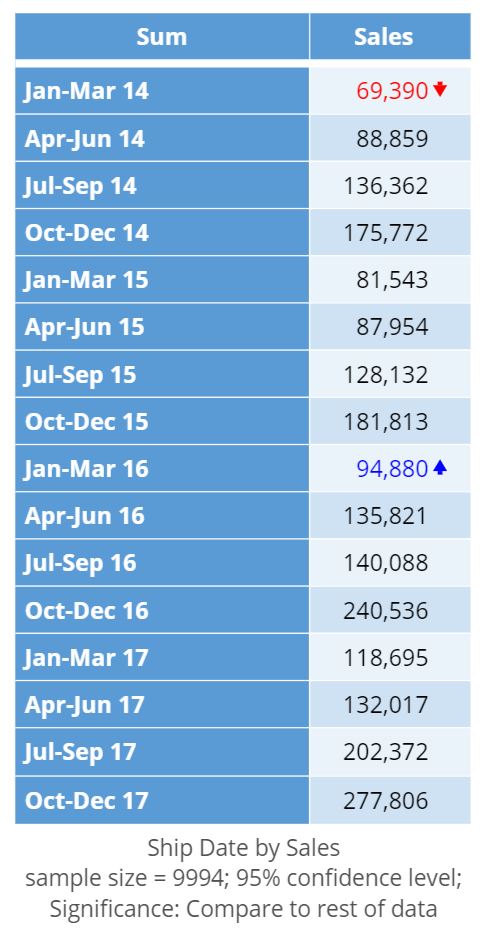
To create an area chart in Displayr with a single variable over time is simple. You need to just have the value variable that you want to plot as well as a time series variable. As an example, we’ll plot quarterly sales revenue for a retail company over time. I first create a table in Displayr with the values I want to plot. To do this, I first drag my Sales variable onto the page to generate a table. I then drag the Ship Date variable onto the table and drop it on Columns. Note that I can get the same result by selecting Ship Date from the Columns drop-down box in Data section of the Object Inspector in the right pane. I’ve also clicked the Swap Rows and Columns button in the Object Inspector to transpose the table (this makes it easier to read).
I can now create an area chart object and use this table as an input to the chart. To create the area chart object, select Insert > Visualization > Area Chart. A chart object is added to the current Page. Next, I go to the Object Inspector and under Data Source in the Inputs section, I select the the chart and select my table above from the Output in ‘Pages’ drop-down box.
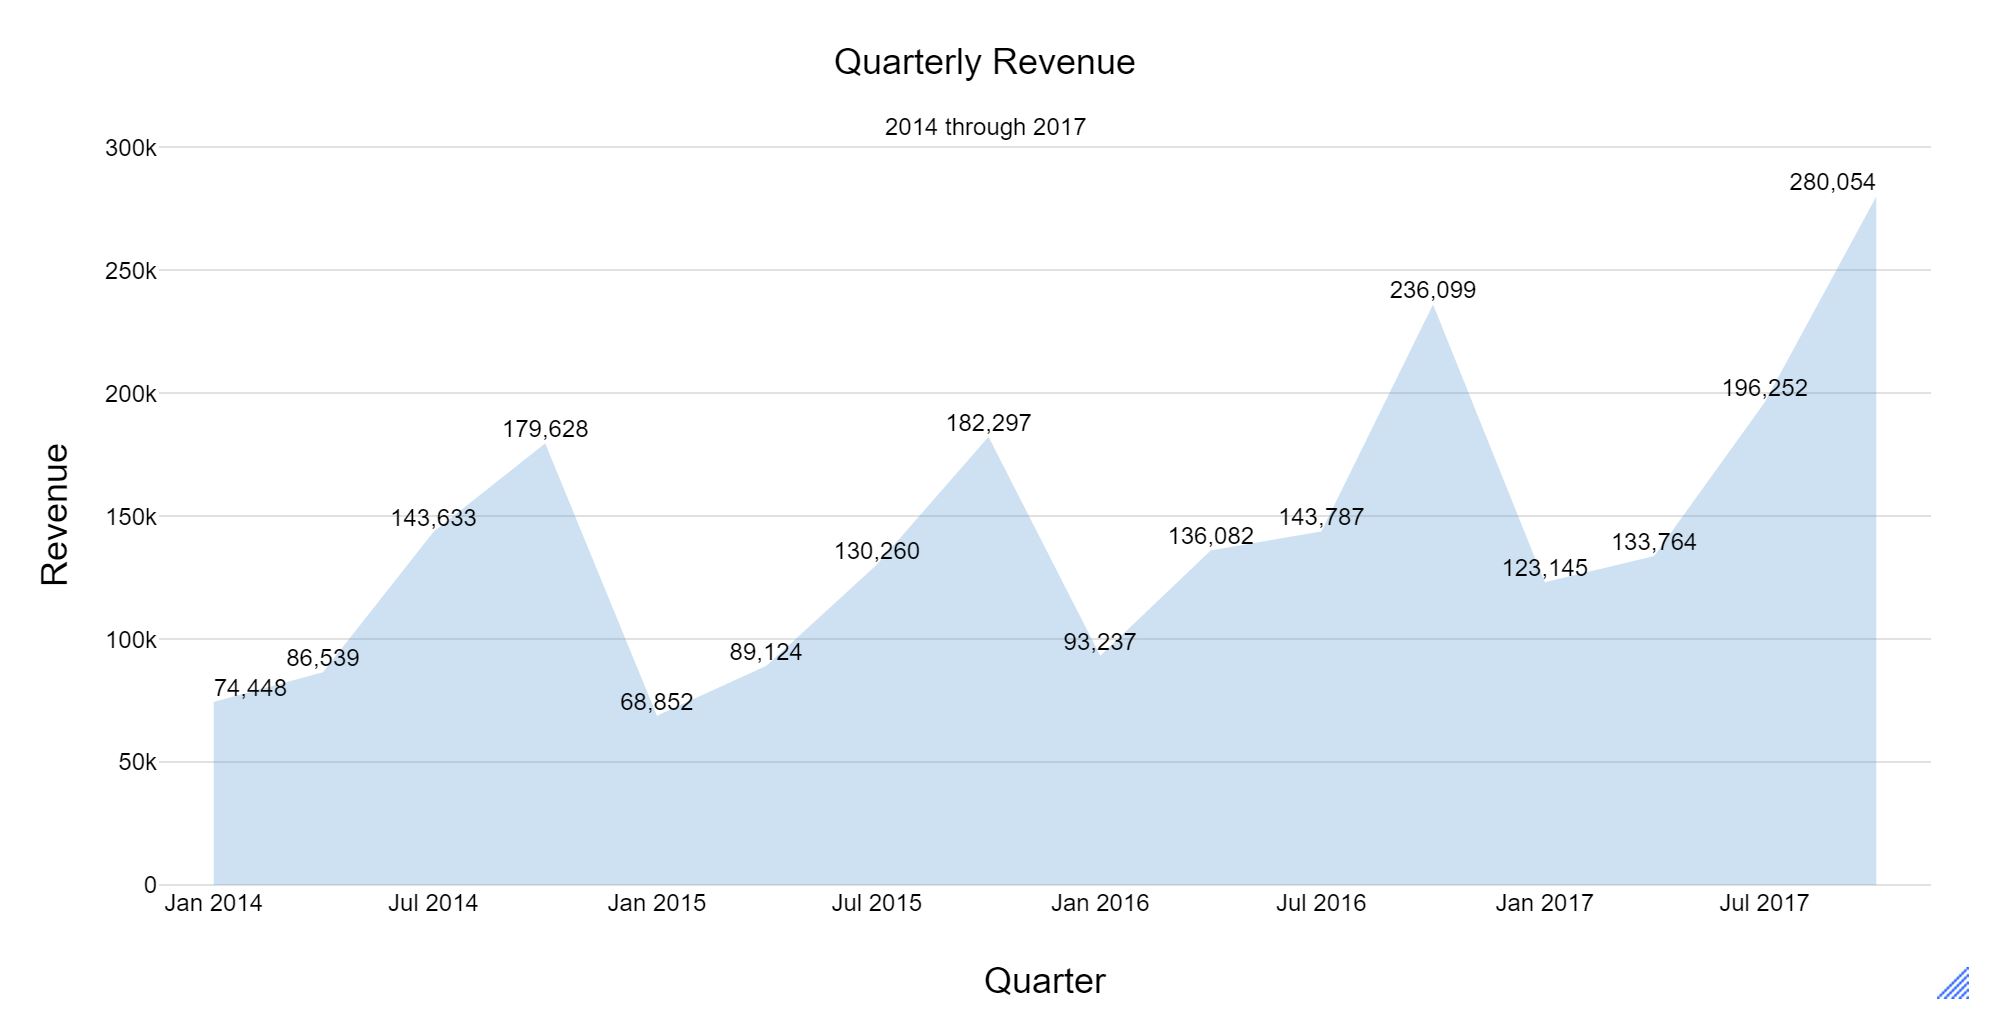
With this area chart, it is easy to see the seasonal retail sales spike during the 4th quarter each year. While this chart is a nice way to visualize the overall sales, a stacked area chart is much more meaningful since it lets one visualize sub-groups while also being able to see the total.
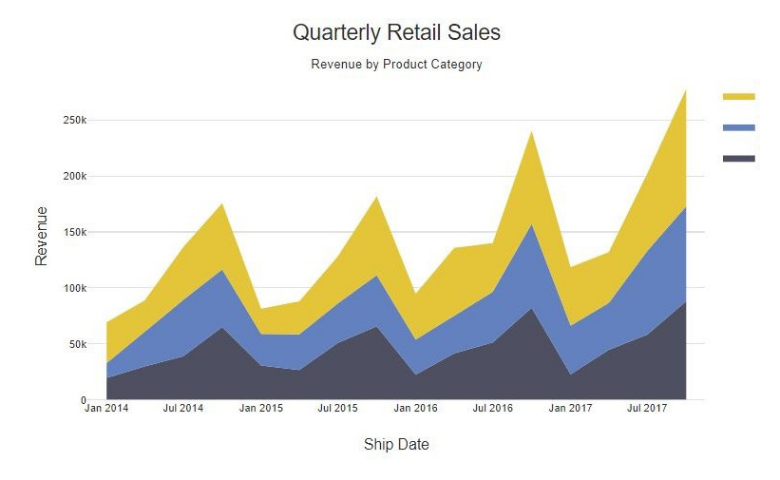
Stacked Area Chart
In this example, we’ll look at the same sales data as before, but this time we will split this by product category which will then be used as input to the stacked area chart. In Displayr, we need to first create a table that will be used as the input to the stacked area chart. Since we are introducing a third variable, product category, we use the Multiway table to create this. Select Insert > More > Tables > Multiway Table. We now select the Rows, Columns and Numeric inputs. For Rows, we select the Ship Date variable, for Columns we select the Category variable and for Numeric we select the Sales variable.
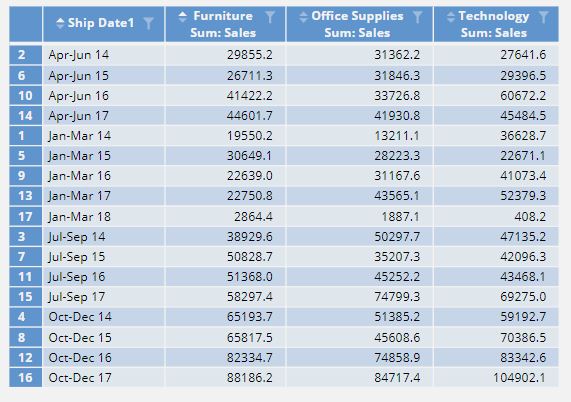
Note that the product categories are split out into columns and the ship dates are split out into rows aggregated by quarter. We now have the input we need to create the stacked area chart. To create the chart, select Insert > Visualization > Area Chart. In the Object Inspector, we have 3 different methods for providing input data to the area chart. In the DATA SOURCE section, use one of the following:
- Output in ‘Pages’ – select a table output. If the table is a cross-tab of two variables, a column-clustered chart will be generated automatically.
- Variables in ‘Data’ – select an individual variable from the Data Sets tree. Once an item is selected a second drop-down called Groups will appear. Here you can select a second cross-tab variable.
- Paste or Type data button – copy and paste data from Excel or some other source directly into a spreadsheet object in Displayr.
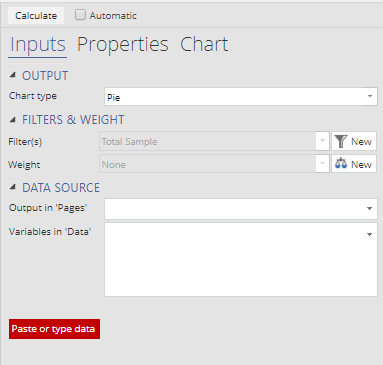
For this example, we will select the Multiway table from the Output in ‘Pages’ drop-down box (note that the default name for a Multiway table is Multiway).
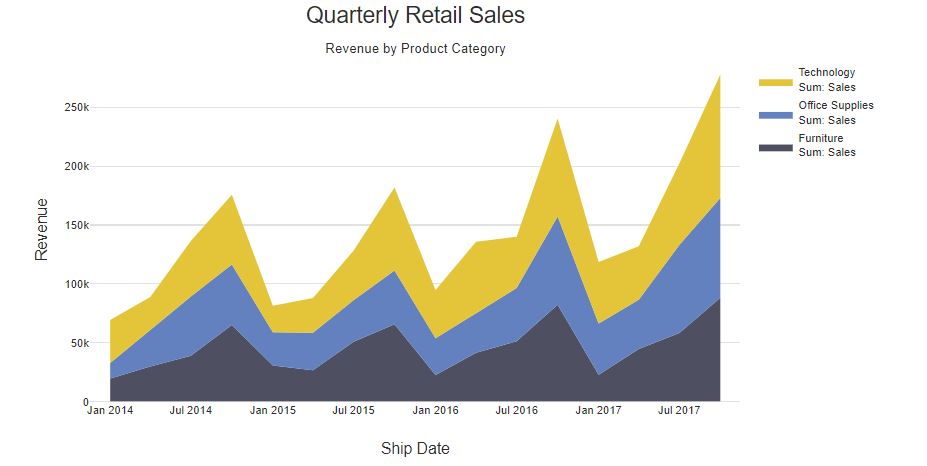
Note that the product categories are stacked on top of each other with the area between the lines representing the revenue or volume for that product category. The total combined sales of the individual product categories are identical to the total sales area chart example above.
I’ve also modified several of the chart properties here, including the chart title, axis labels, and color palette. All of the chart properties can be modified in the Chart section of the Object Inspector.
Create your own area chart, or learn how to do more in Displayr by checking out Using Displayr!